

Project Overview
Analysed historical influenza data to support a medical staffing agency’s deployment strategy. The project assessed correlations to identify high-risk population groups, examined seasonal patterns, and developed a state-level risk profile to forecast when, where, and how many staff would be needed.
Tools Used
- Excel – Data Preparation | Analysis
- Word – Reporting
- Tableau – Visualisation | Forecasting | Storytelling
Skills Demonstrated
- Project Research | Design | Planning
- Data Exploration | Description | Profiling | Cleaning | Transformation & Integration
- Descriptive Statistics | Statistical Analysis | Hypothesis Testing | Trend Analysis | Seasonal Forecasting
- Deriving Insights | Data Visualisation | Reporting | Storytelling
Data Sourced
This analysis uses publicly available data sourced from the Centres for Disease Control and Prevention (CDC) and the US Census Bureau that cover the period 2009 to 2017. The data was provided by CareerFoundry as part of their Data Analytics Course.
- Influenza-related deaths – Number of deaths by location, time, and age.
- Population – Number of people by location, time, age, and gender.
Key Insights
Vulnerable Populations – Who?
Adults aged 65+ accounted for over 60% of flu-related deaths, confirming their high-risk status and the need for targeted planning.
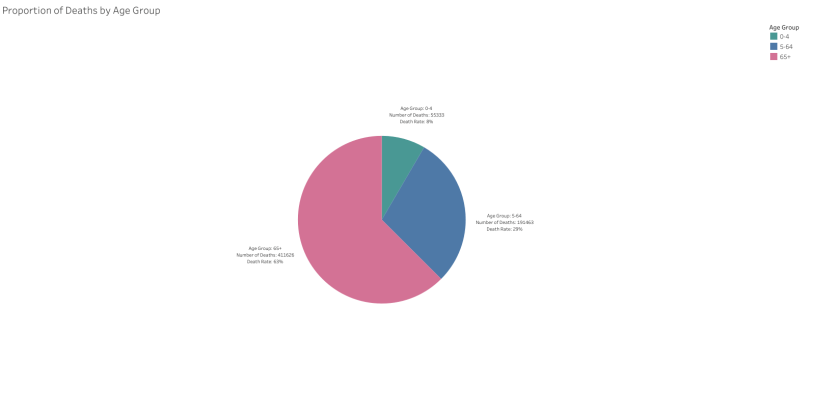
Pie Chart — Deaths by Age group
Adults aged 65 and older accounted for over 60% of influenza-related deaths, highlighting their disproportionate risk.
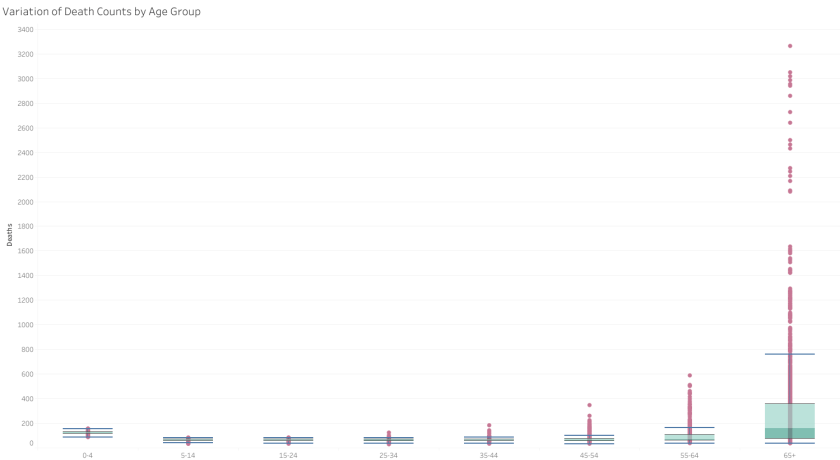
Box Plot – Deaths by Age Group
The 65+ age group had the highest median mortality and widest range, reinforcing their vulnerability
Seasonality – When?
Peak mortality occurred in January each year, with Southern states often reporting the highest totals — though at-risk states weren’t limited to that region.
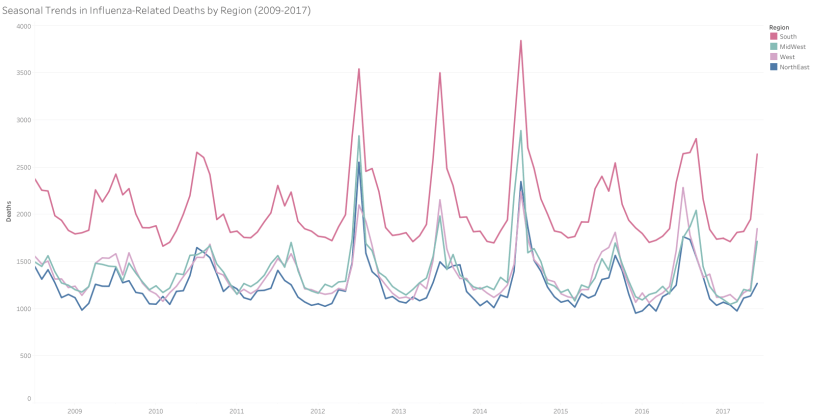
Line Chart — Regional Yearly Trends
A clear seasonal trend in flu deaths is observed, with the South exhibiting consistently higher counts than other regions, which remained closely aligned throughout.
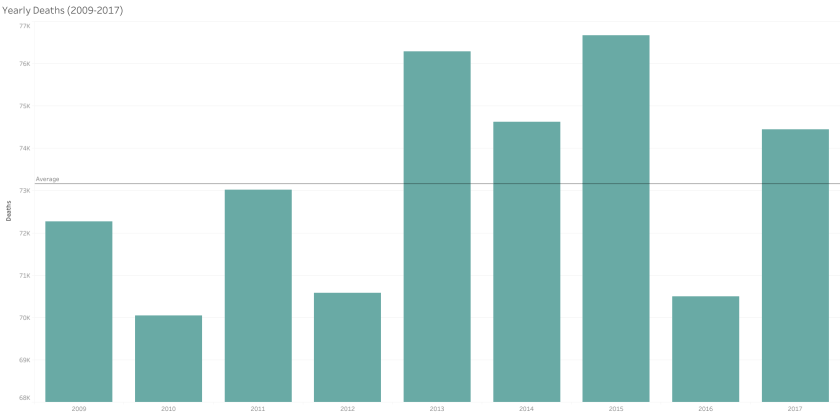
Bar Chart — Annual Death Totals
Flu season severity varied year to year, with notable spikes in 2013 and 2015.
Risk Classification & Forecasting – Where & How Many?
States were classified into high, medium, and low risk based on their elderly populations, guiding an effective resource allocation framework.
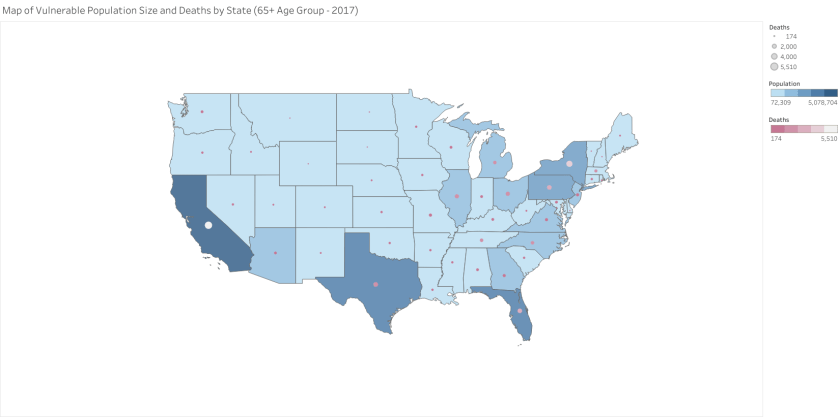
Choropleth Map — 65+ Population & Deaths by State
Flu season severity varied year to year, with notable spikes in 2013 and 2015.
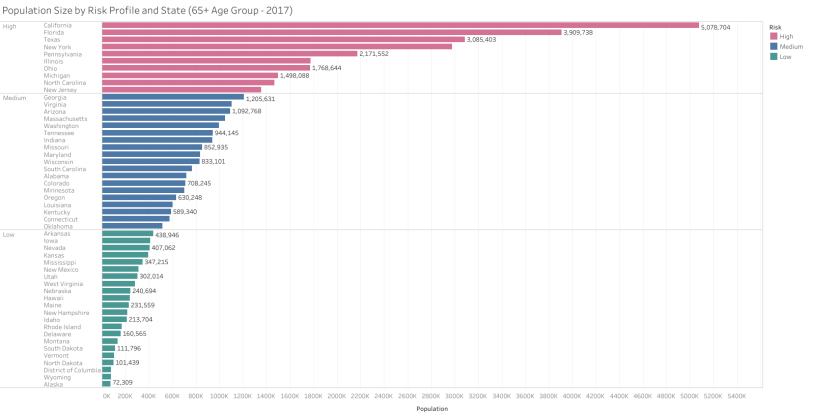
Bar Chart — 65+ Population by Risk Profile
States were grouped into high, medium, and low risk based on elderly population size to suport targeted planning.
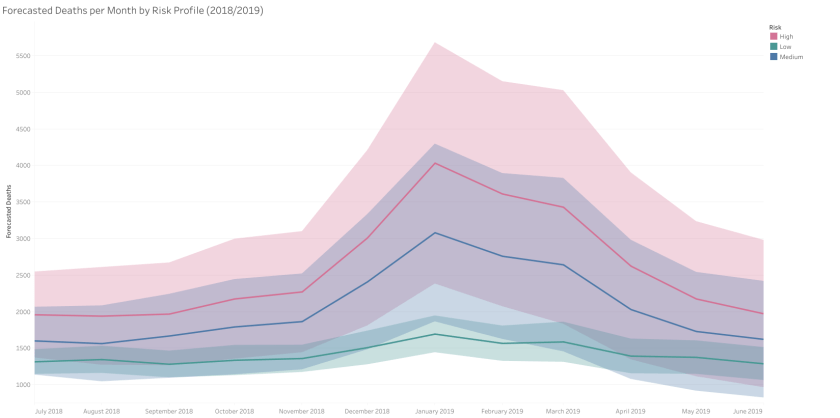
Line Chart — Forecasted Deaths by Risk Group
Flu season severity varied year to year, with notable spikes in 2013 and 2015.
Key Takeaways
Recommendations
- Prioritise high-risk states
States with the largest 65+ populations should receive the majority of seasonal staffing resources, especially between December and February.
- Use risk classification
Tiering states into high, medium, and low risk allows for efficient and scalable resource planning.
- Monitor early trends
Real-time data in November can help forecast flu season severity and guide flexible staffing adjustments.
Links & Deliverables
- GitHub Repository — Excel Workbooks | Interim Report
- Tableau Public — Interactive Storyboard
- Case Study — Read the Detailed Case Study
