

Analysis & Insights – Objective 2
Determine when influenza season typically starts and ends, and how its severity varies year to year.
Q3 – When does influenza season typically start and end?
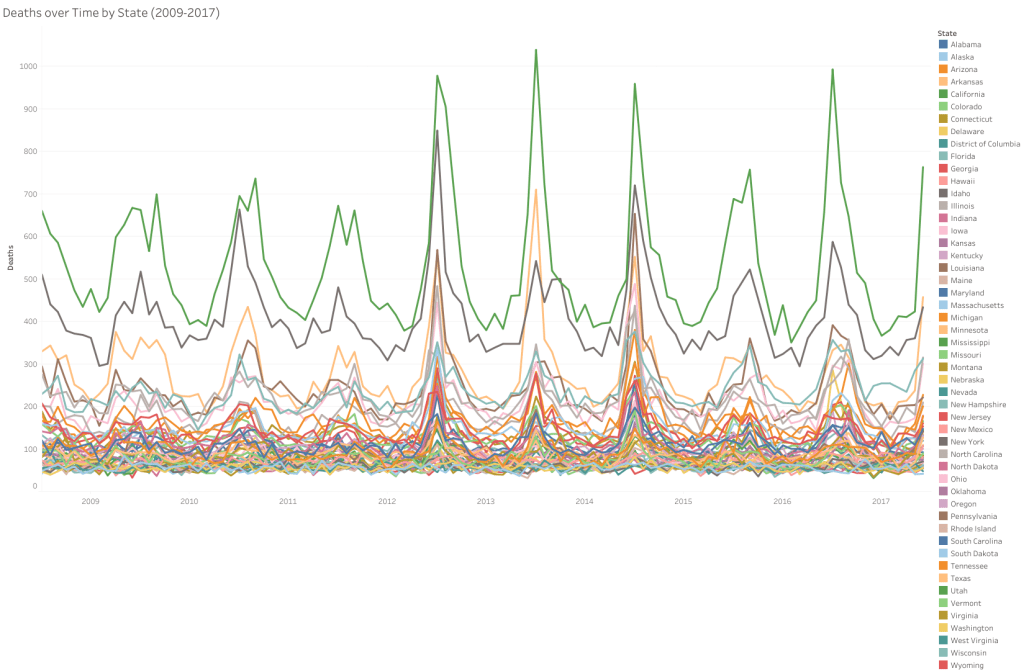
To evaluate the seasonal nature of influenza-related mortality, the analysis began at the state level and then progressed to regional patterns and yearly comparisons. Weekly and monthly trends were used to establish timing, while annual totals were used to assess fluctuation in severity.
Weekly data for each state revealed consistent seasonal peaks during winter, particularly between December and March. These recurring surges confirm the predictable timing of influenza mortality across the U.S.
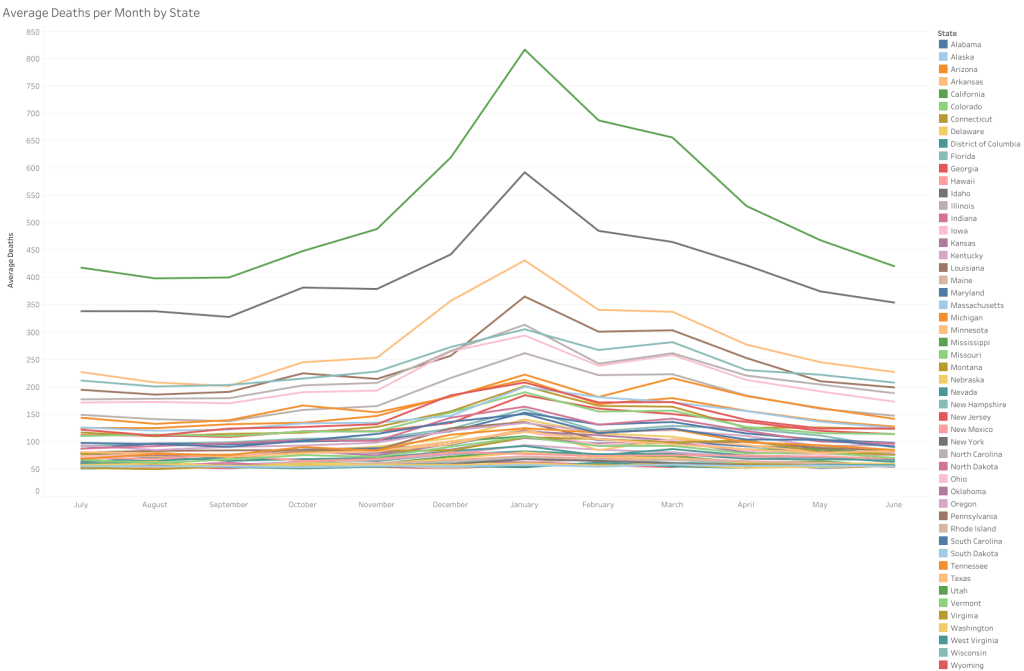
Aggregating the data to monthly averages reinforced the timing of flu season. Most states exhibited a clear rise in deaths beginning in November, peaking in January, and tapering off by April.
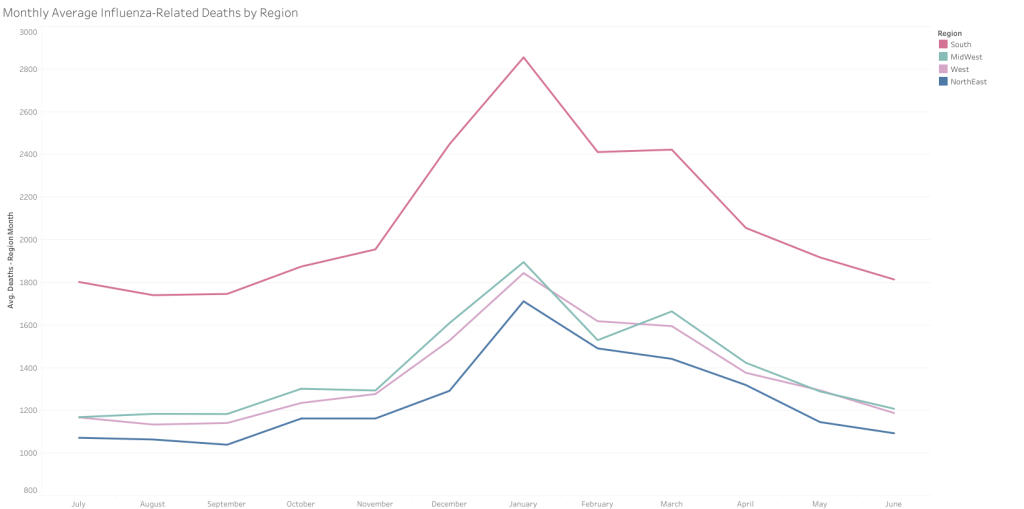
Grouping states into regions confirmed a uniform seasonal structure. All regions showed synchronised winter peaks, with the South consistently experiencing higher mortality compared to the Midwest, West, and Northeast, which followed near-identical trends.
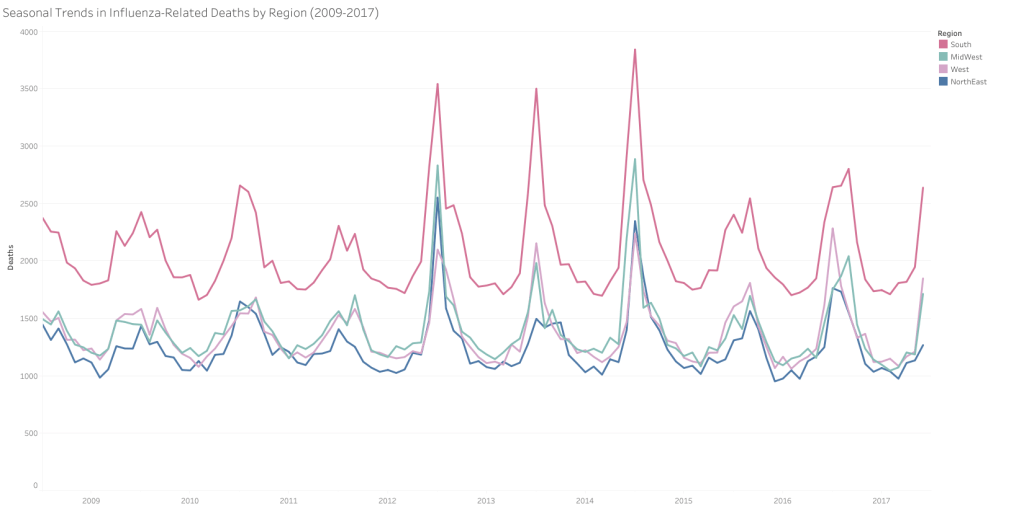
This regional breakdown illustrated that while all regions peak in January, the South shows a notably higher average throughout the season — potentially reflecting a larger vulnerable population or lower vaccination coverage.
Q4 – How does the severity of influenza vary from year to year?
Despite consistent seasonal timing, total deaths varied significantly across years. Spikes in 2013 and 2015 illustrate that while influenza season is predictable in timing, its intensity can fluctuate. The average annual mortality was 73,158, providing a benchmark for future comparison.

