
Analysis & Insights – Objective 1
Assess the relationship between vulnerable populations and influenza mortality.
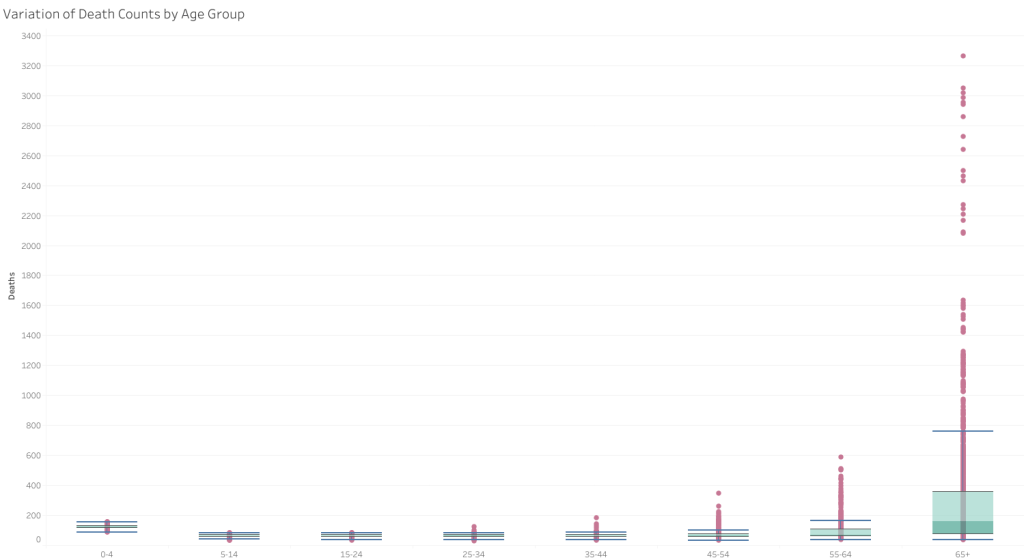
Q1 – Which age groups are most affected by influenza?
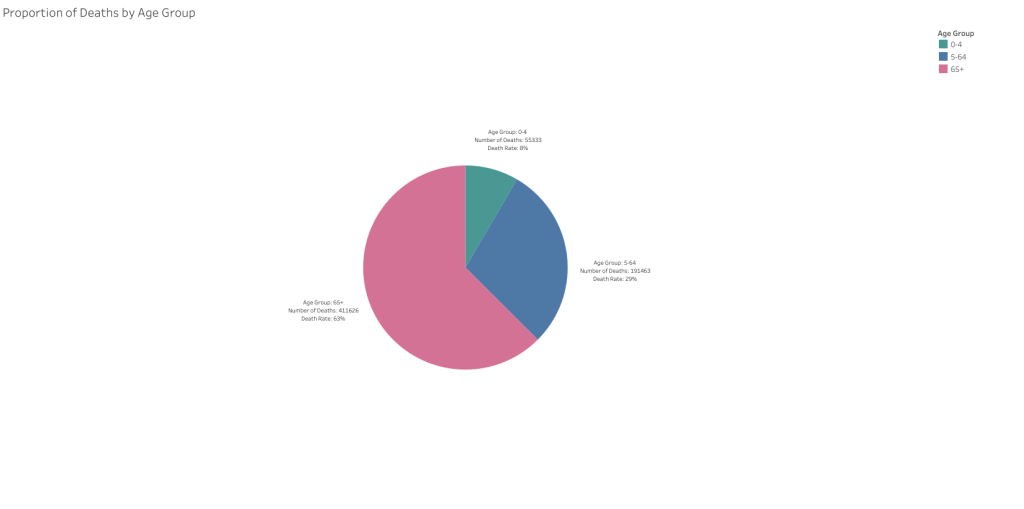
The majority of influenza-related deaths occur among adults aged 65 and older, accounting for over 60% of total fatalities. This demographic pattern reinforces the CDC’s classification of this group as high risk and underlines their importance in any flu season response strategy.
As weekly death counts increase, the proportion attributed to the 65+ age group rises sharply. In all weeks where deaths exceeded 100, older adults were responsible for nearly all cases, highlighting their disproportionate burden during periods of peak mortality.
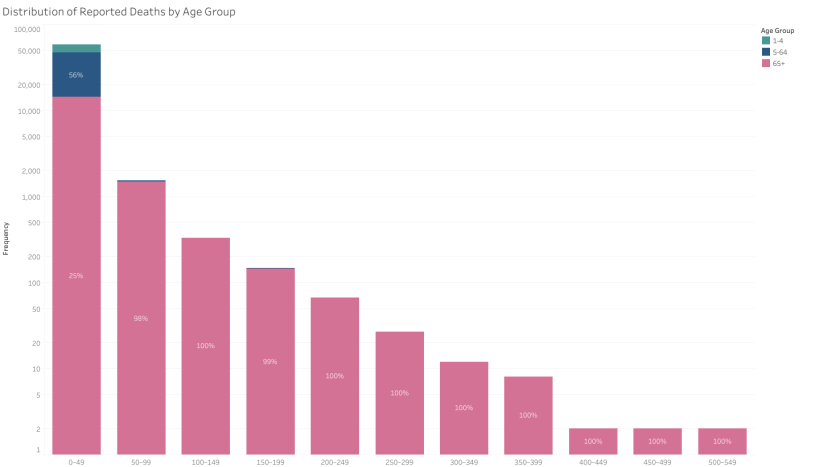
Death counts for the 65+ age group not only show the highest median values but also the widest variation, reflecting both elevated mortality and the greater fluctuation in outcomes compared to younger groups. In contrast, younger age groups display lower and more consistent death counts.
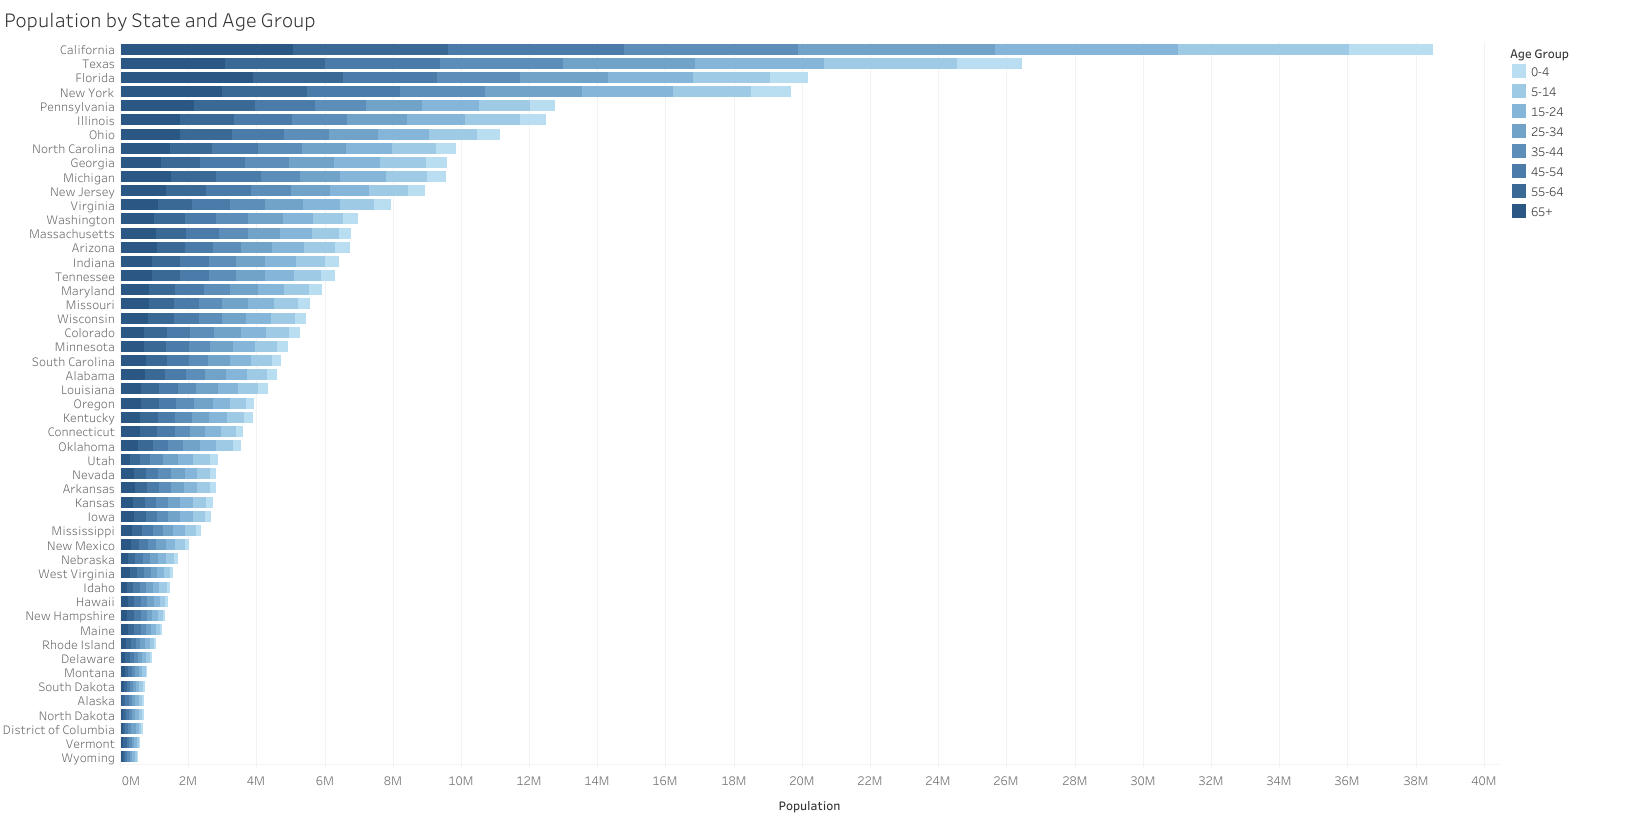
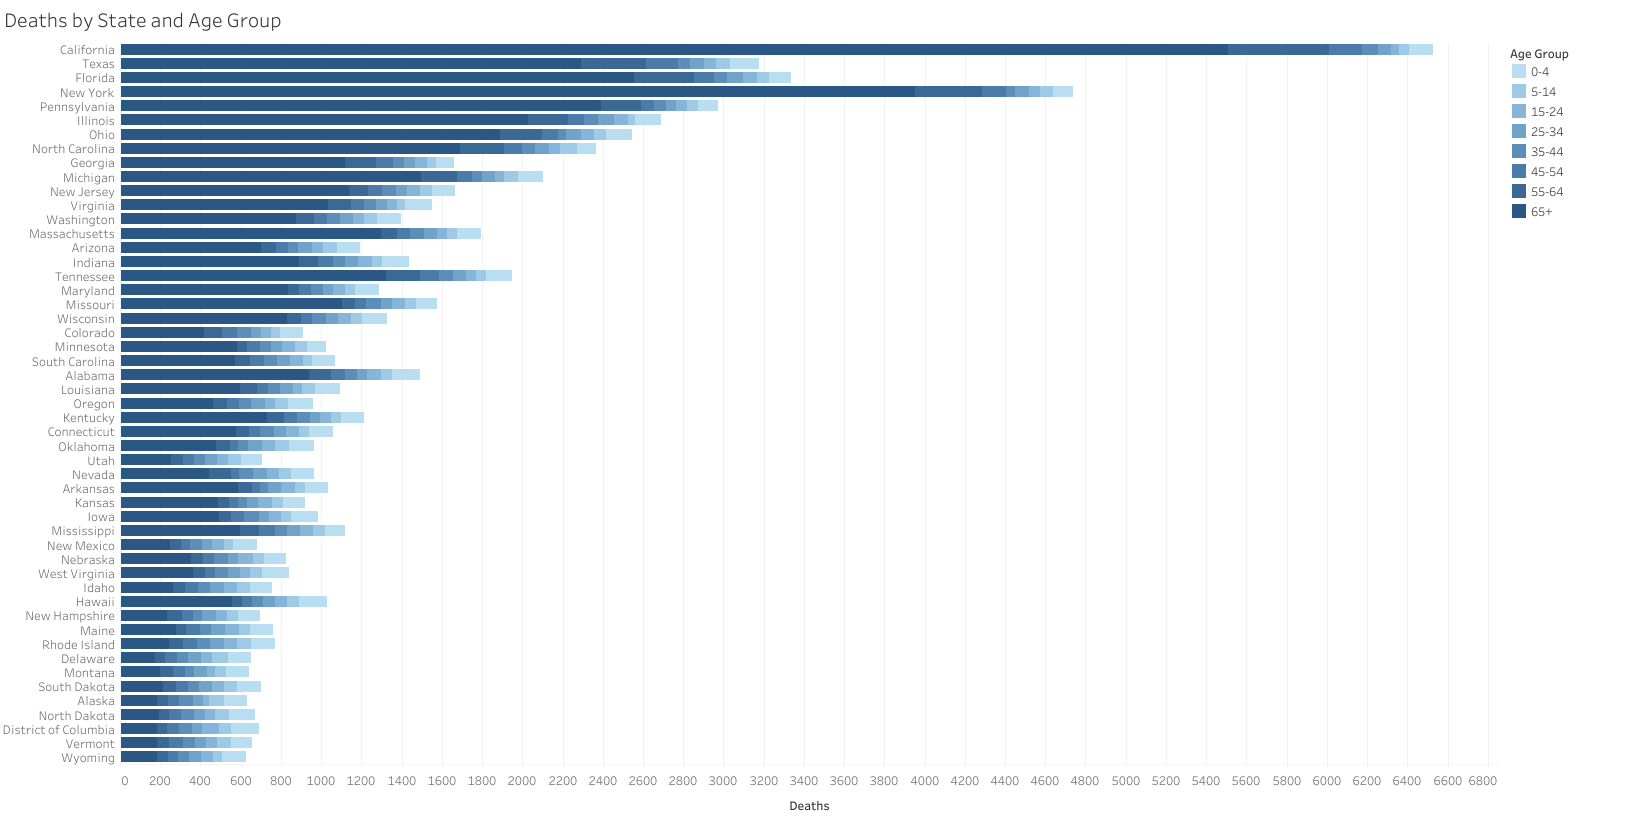
Older adult deaths are heavily concentrated in high-population states such as California, New York, and Florida. This pattern reflects both demographic concentration and age-related mortality risk.

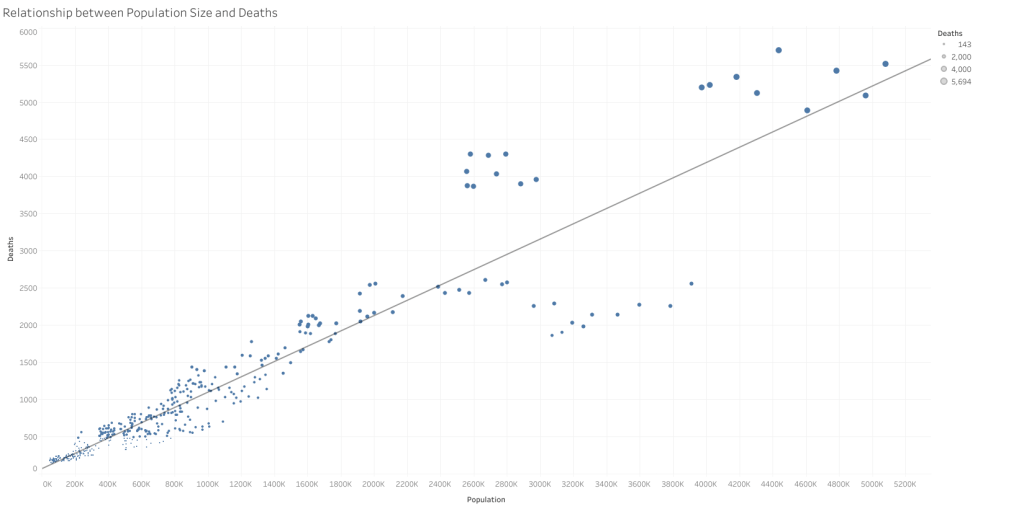
Q2 – Is there a relationship between population size and influenza-related deaths?
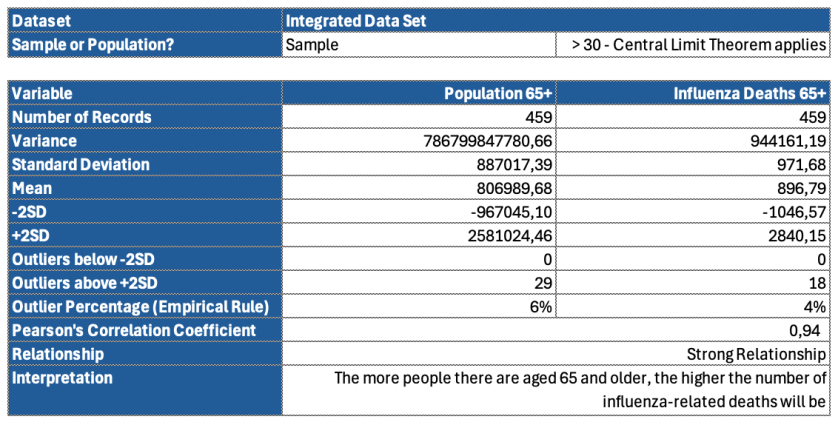
Statistical analysis revealed a strong positive correlation (r = 0.94) between the size of a state’s 65+ population and the number of influenza-related deaths, suggesting that population size is a significant driver of mortality risk among older adults.
While 6% of 65+ population values fell above two standard deviations, these outliers corresponded to the four largest U.S. states — California, Texas, Florida, and New York — and were retained, as they represent demographically significant cases rather than anomalies.
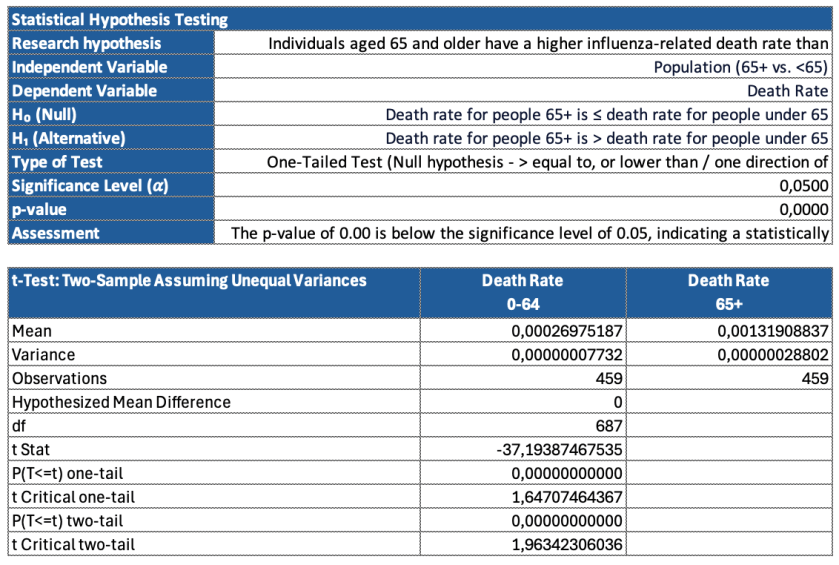
To statistically validate this relationship, a one-tailed two-sample t-test assuming unequal variances was conducted. The comparison of influenza-related death rates between individuals aged 65+ and those under 65 yielded a p-value of < 0.001. This result provided strong evidence against the null hypothesis, confirming that older adults experience significantly higher influenza-related mortality than their younger counterparts.
A strong positive correlation exists between the size of the 65+ population in a state and the number of influenza-related deaths. This trend confirms that population size is a key driver of mortality risk in older adults, with higher populations correlating closely with higher death counts.
Visualising a breakdown of influenza-related deaths by age group and state confirms that mortality increases with age, despite relatively balanced age distributions.