
Analysis & Insights – Objective 2
Customer Profiling & Ordering Habits
Q5 – How can ordering behaviour and demographic information be used to categorise customers?
Ordering Trends
Initial categorisation of customers was based on order behaviour, using the interquartile range (IQR) to create the following variables with three categories each:
- Activity – Total number of orders placed.
- Spending – Average amount spent per product.
- Frequency – Median number of days between orders.
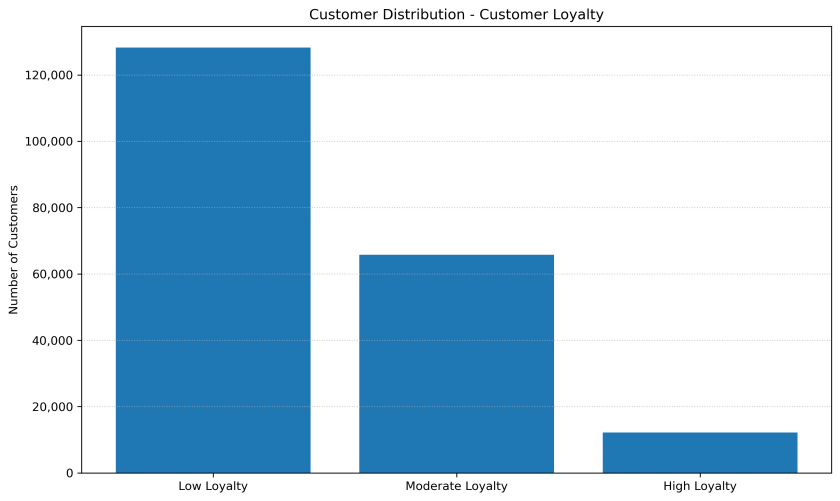
Each variable was assigned a score from 1 to 3, based on the category. These scores were then summed to calculate a loyalty score, which was further segmented using the IQR method to define loyalty categories:
- Low Loyalty – Combined score of 5 or less
- Moderate Loyalty – Combined score above 5 but ≤ 7
- High Loyalty – Combine score above 7
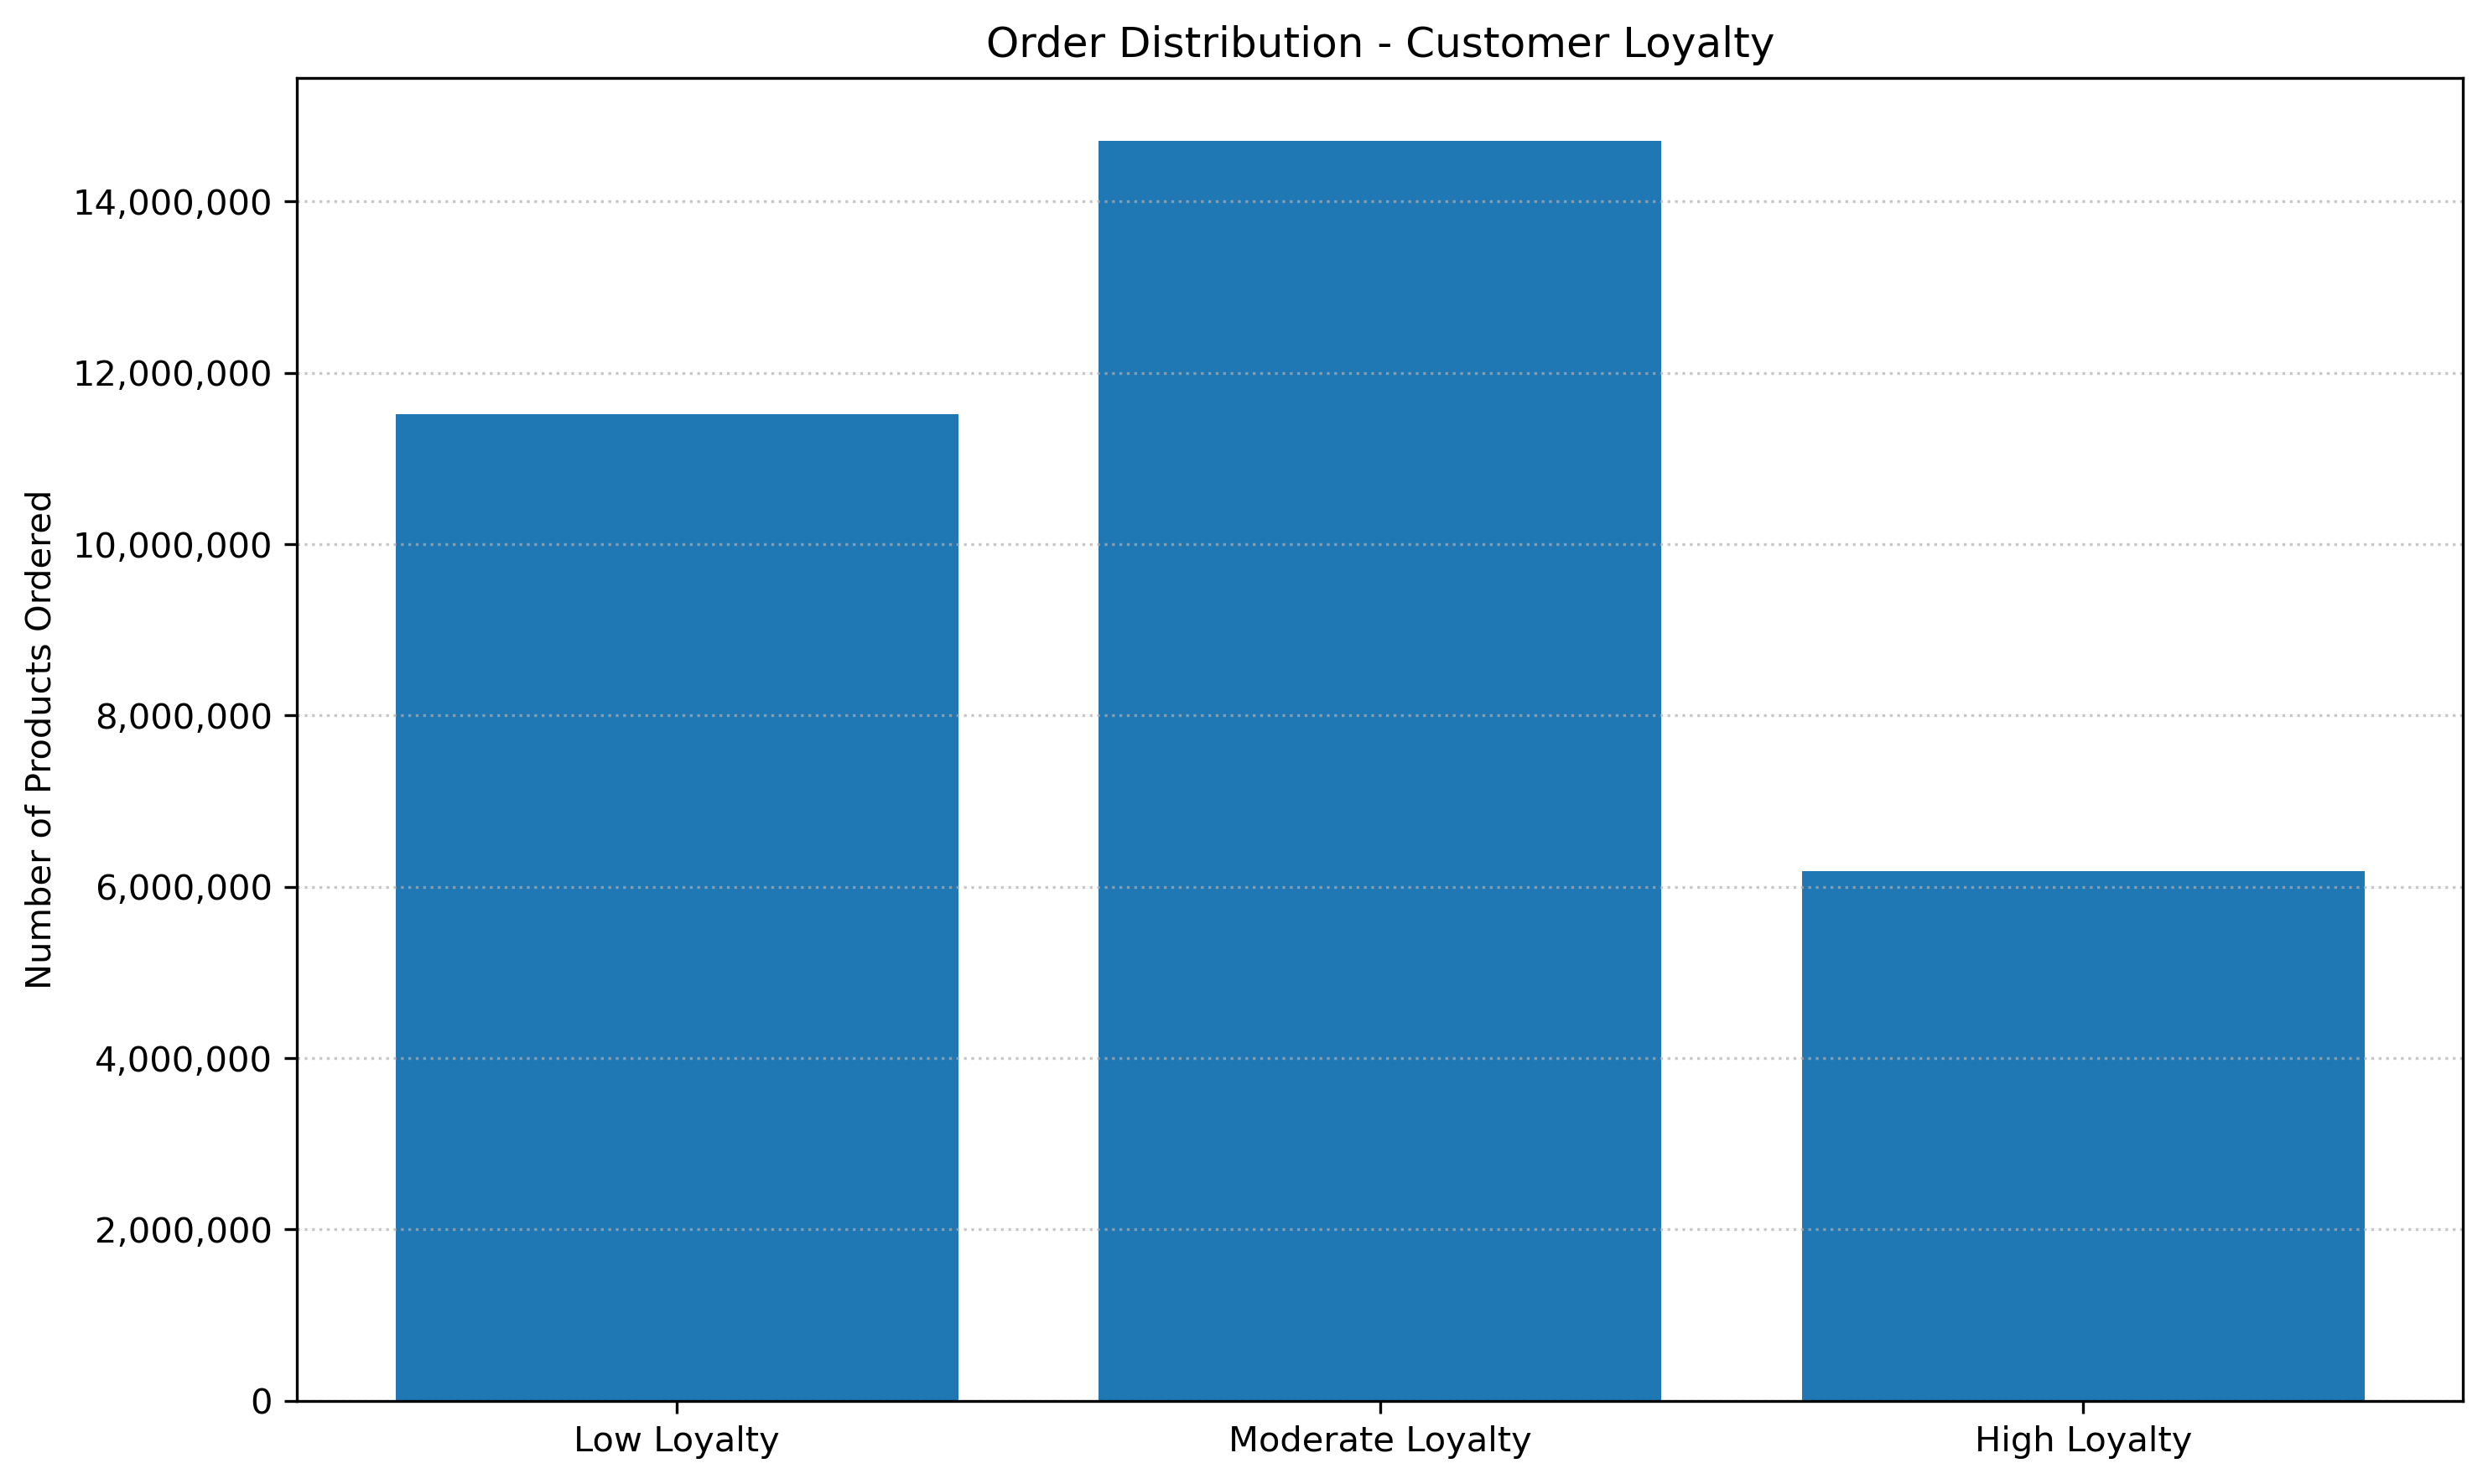
Bar chart analysis showed that most customers fall into the low activity and rare shopper categories, with moderate spending. Consequently, low loyalty customers represent the largest segment.
Demographic Information
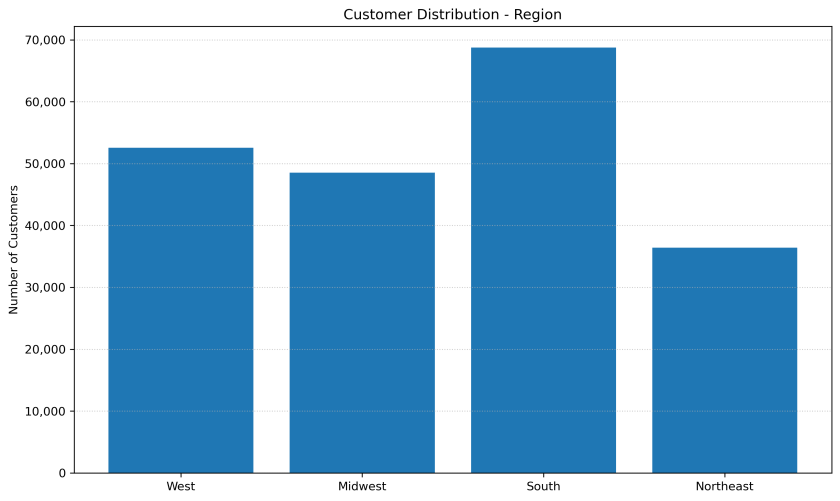
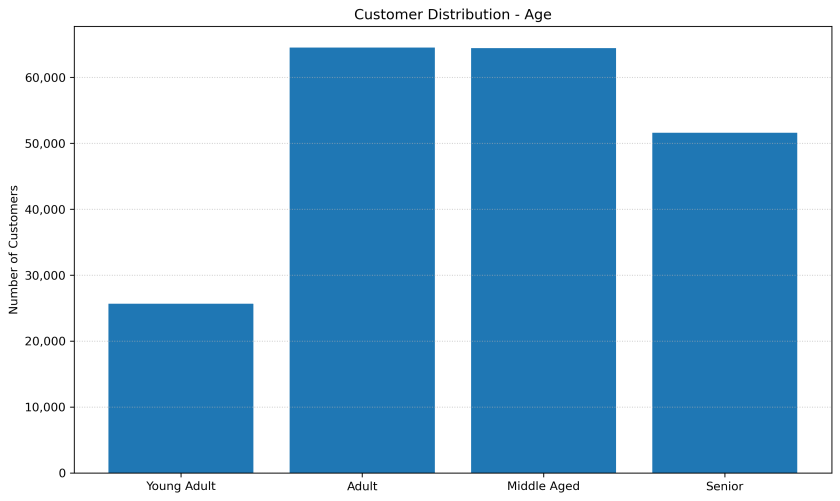
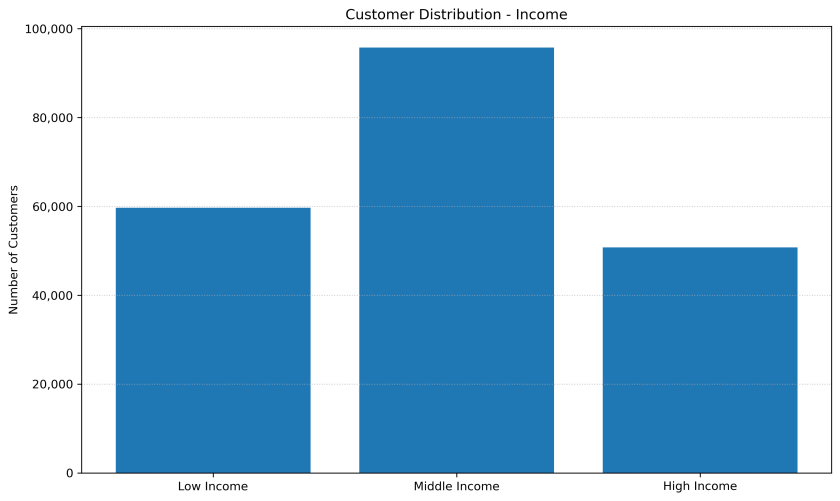
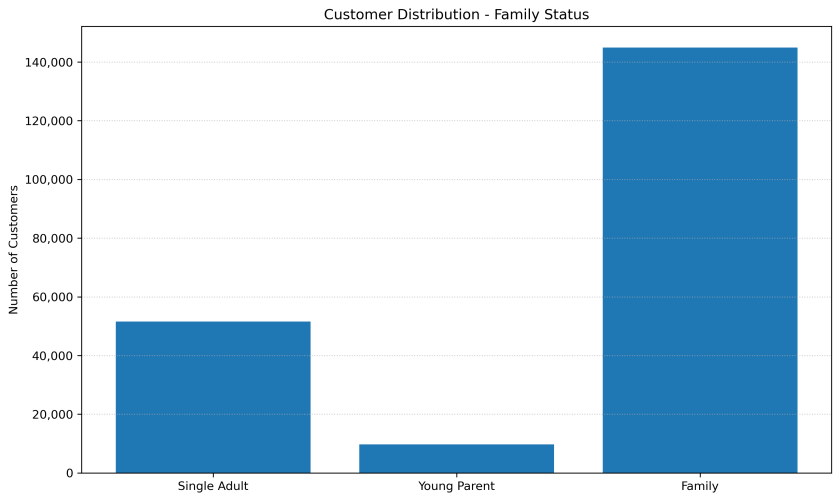
Customers were further categorised by region, income, age, and family status. Family status was derived from marital status and the number of dependents, allowing segmentation based on household composition.
Analysis revealed that most customers are adults or middle aged and have a families. The majority of customers earned within the middle income range and were primarily located in the South.
Q6: How does ordering habits vary across customer profiles?
Customer Loyalty
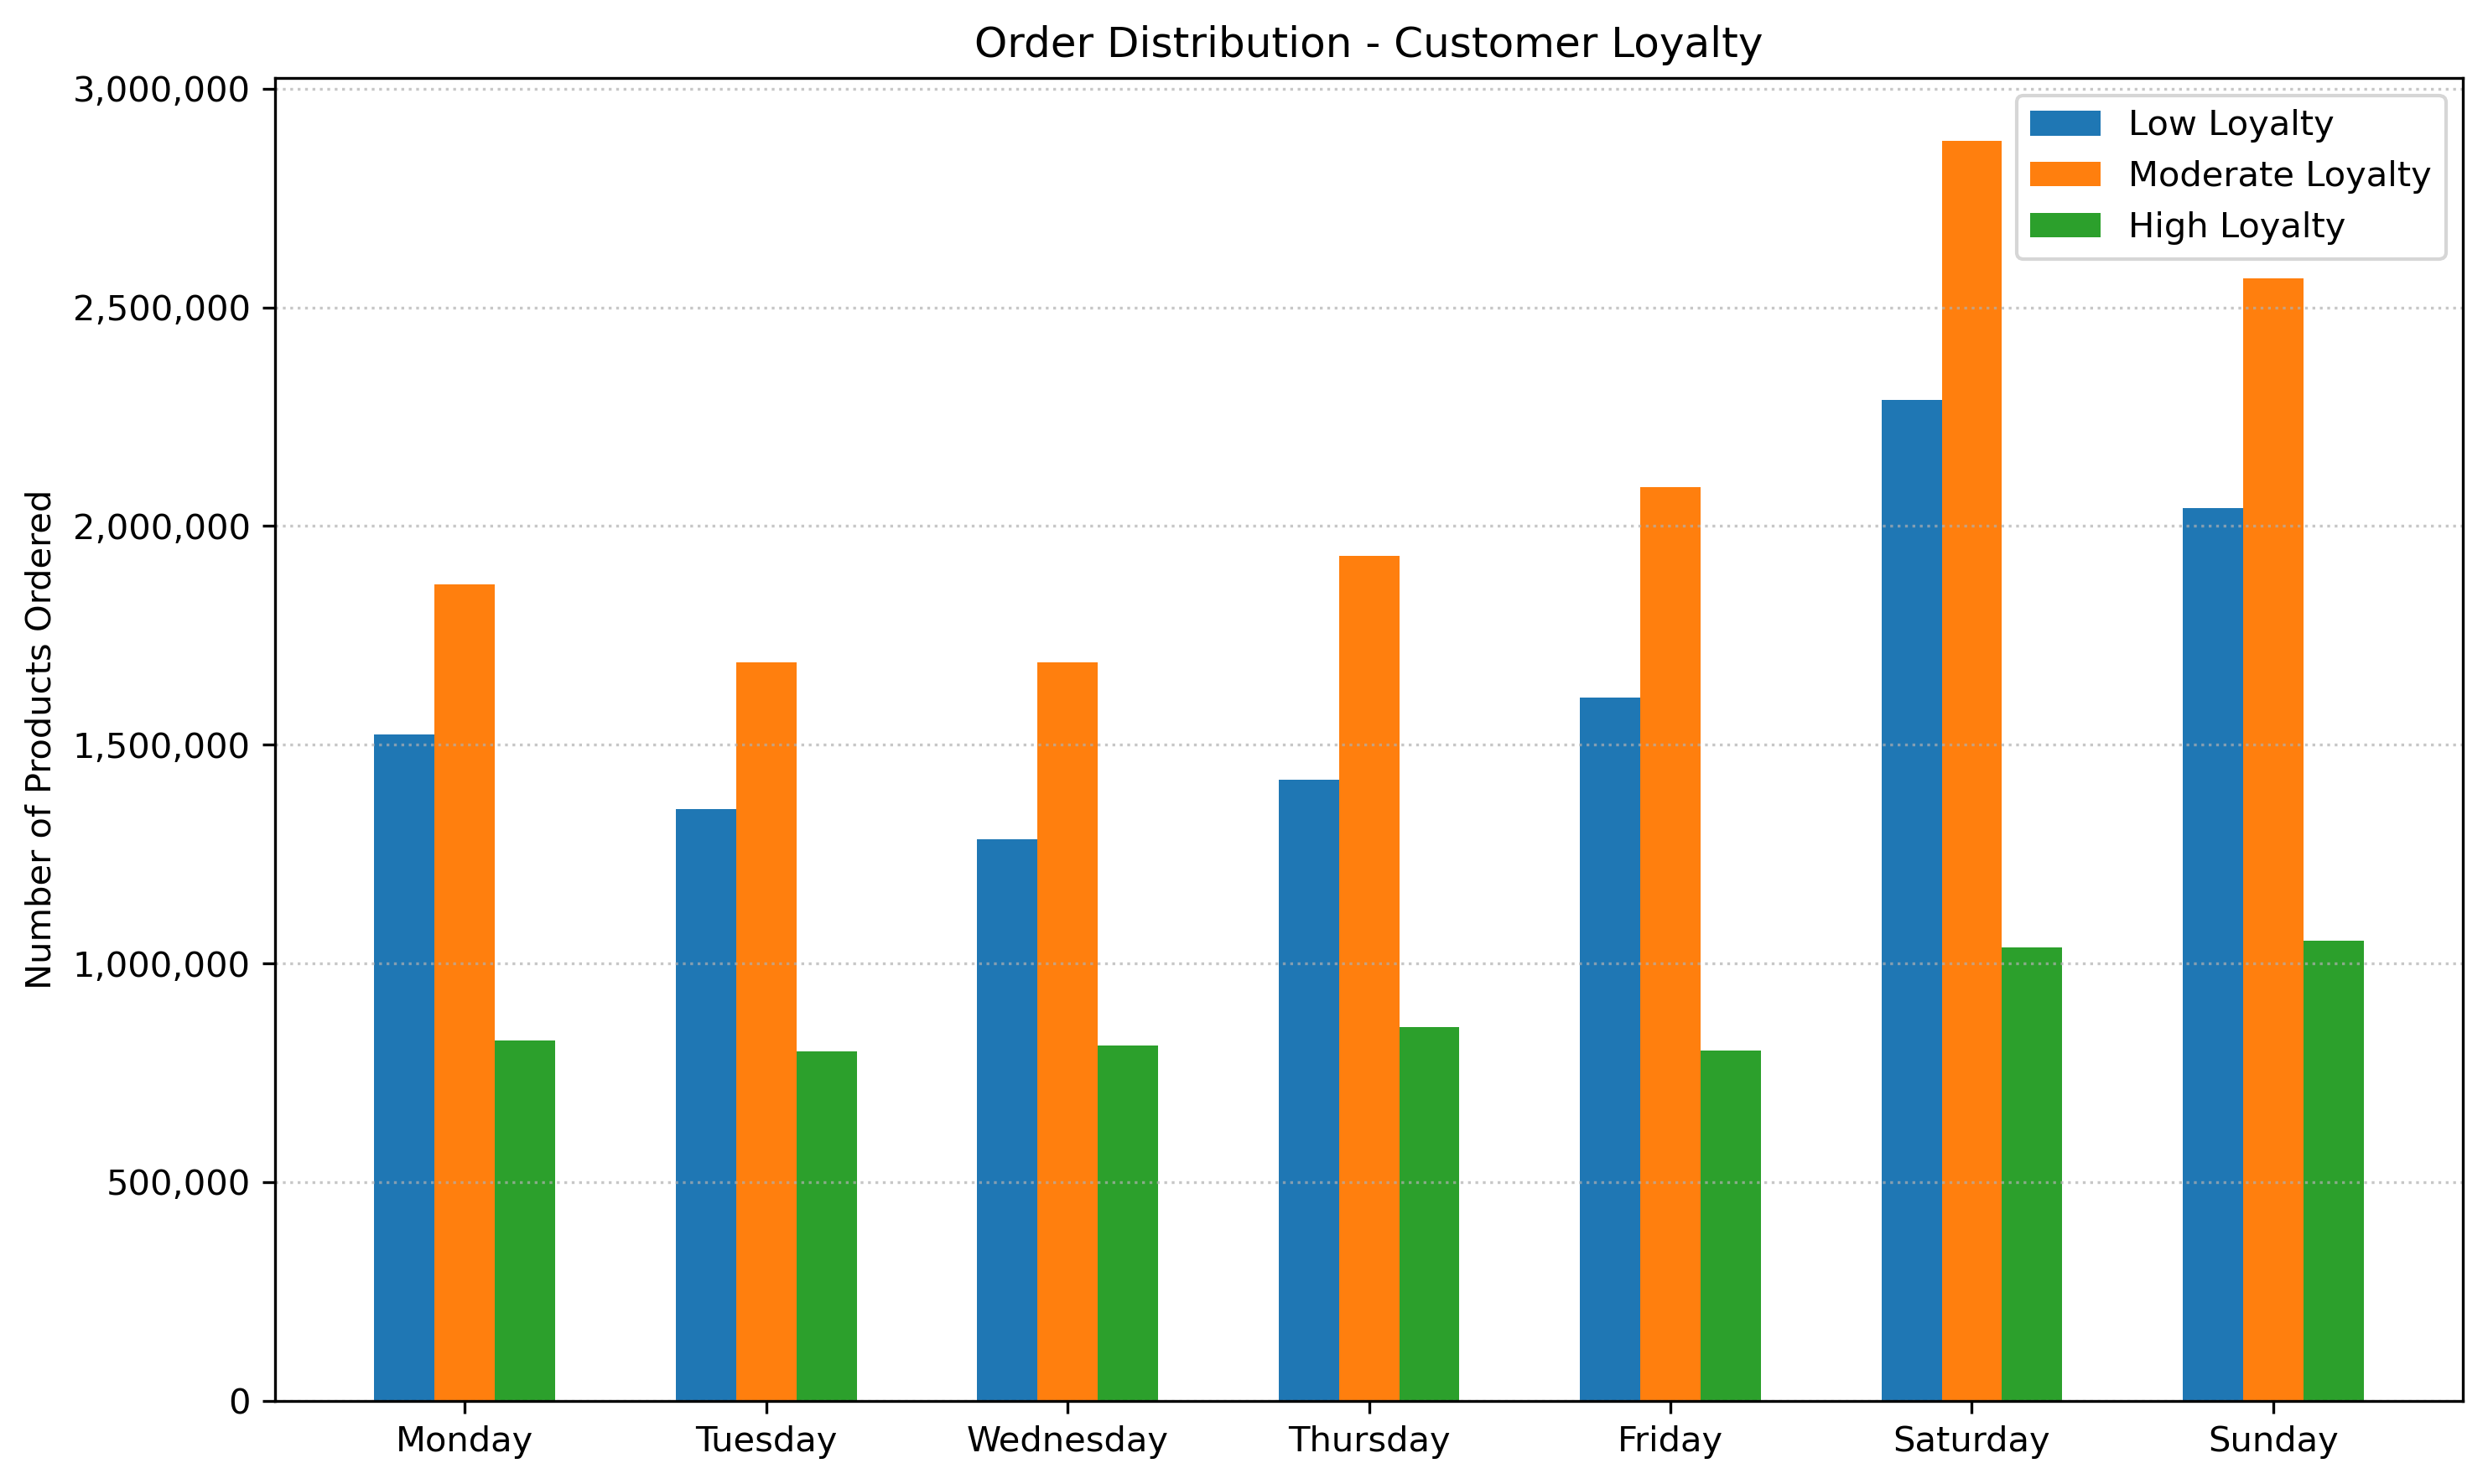
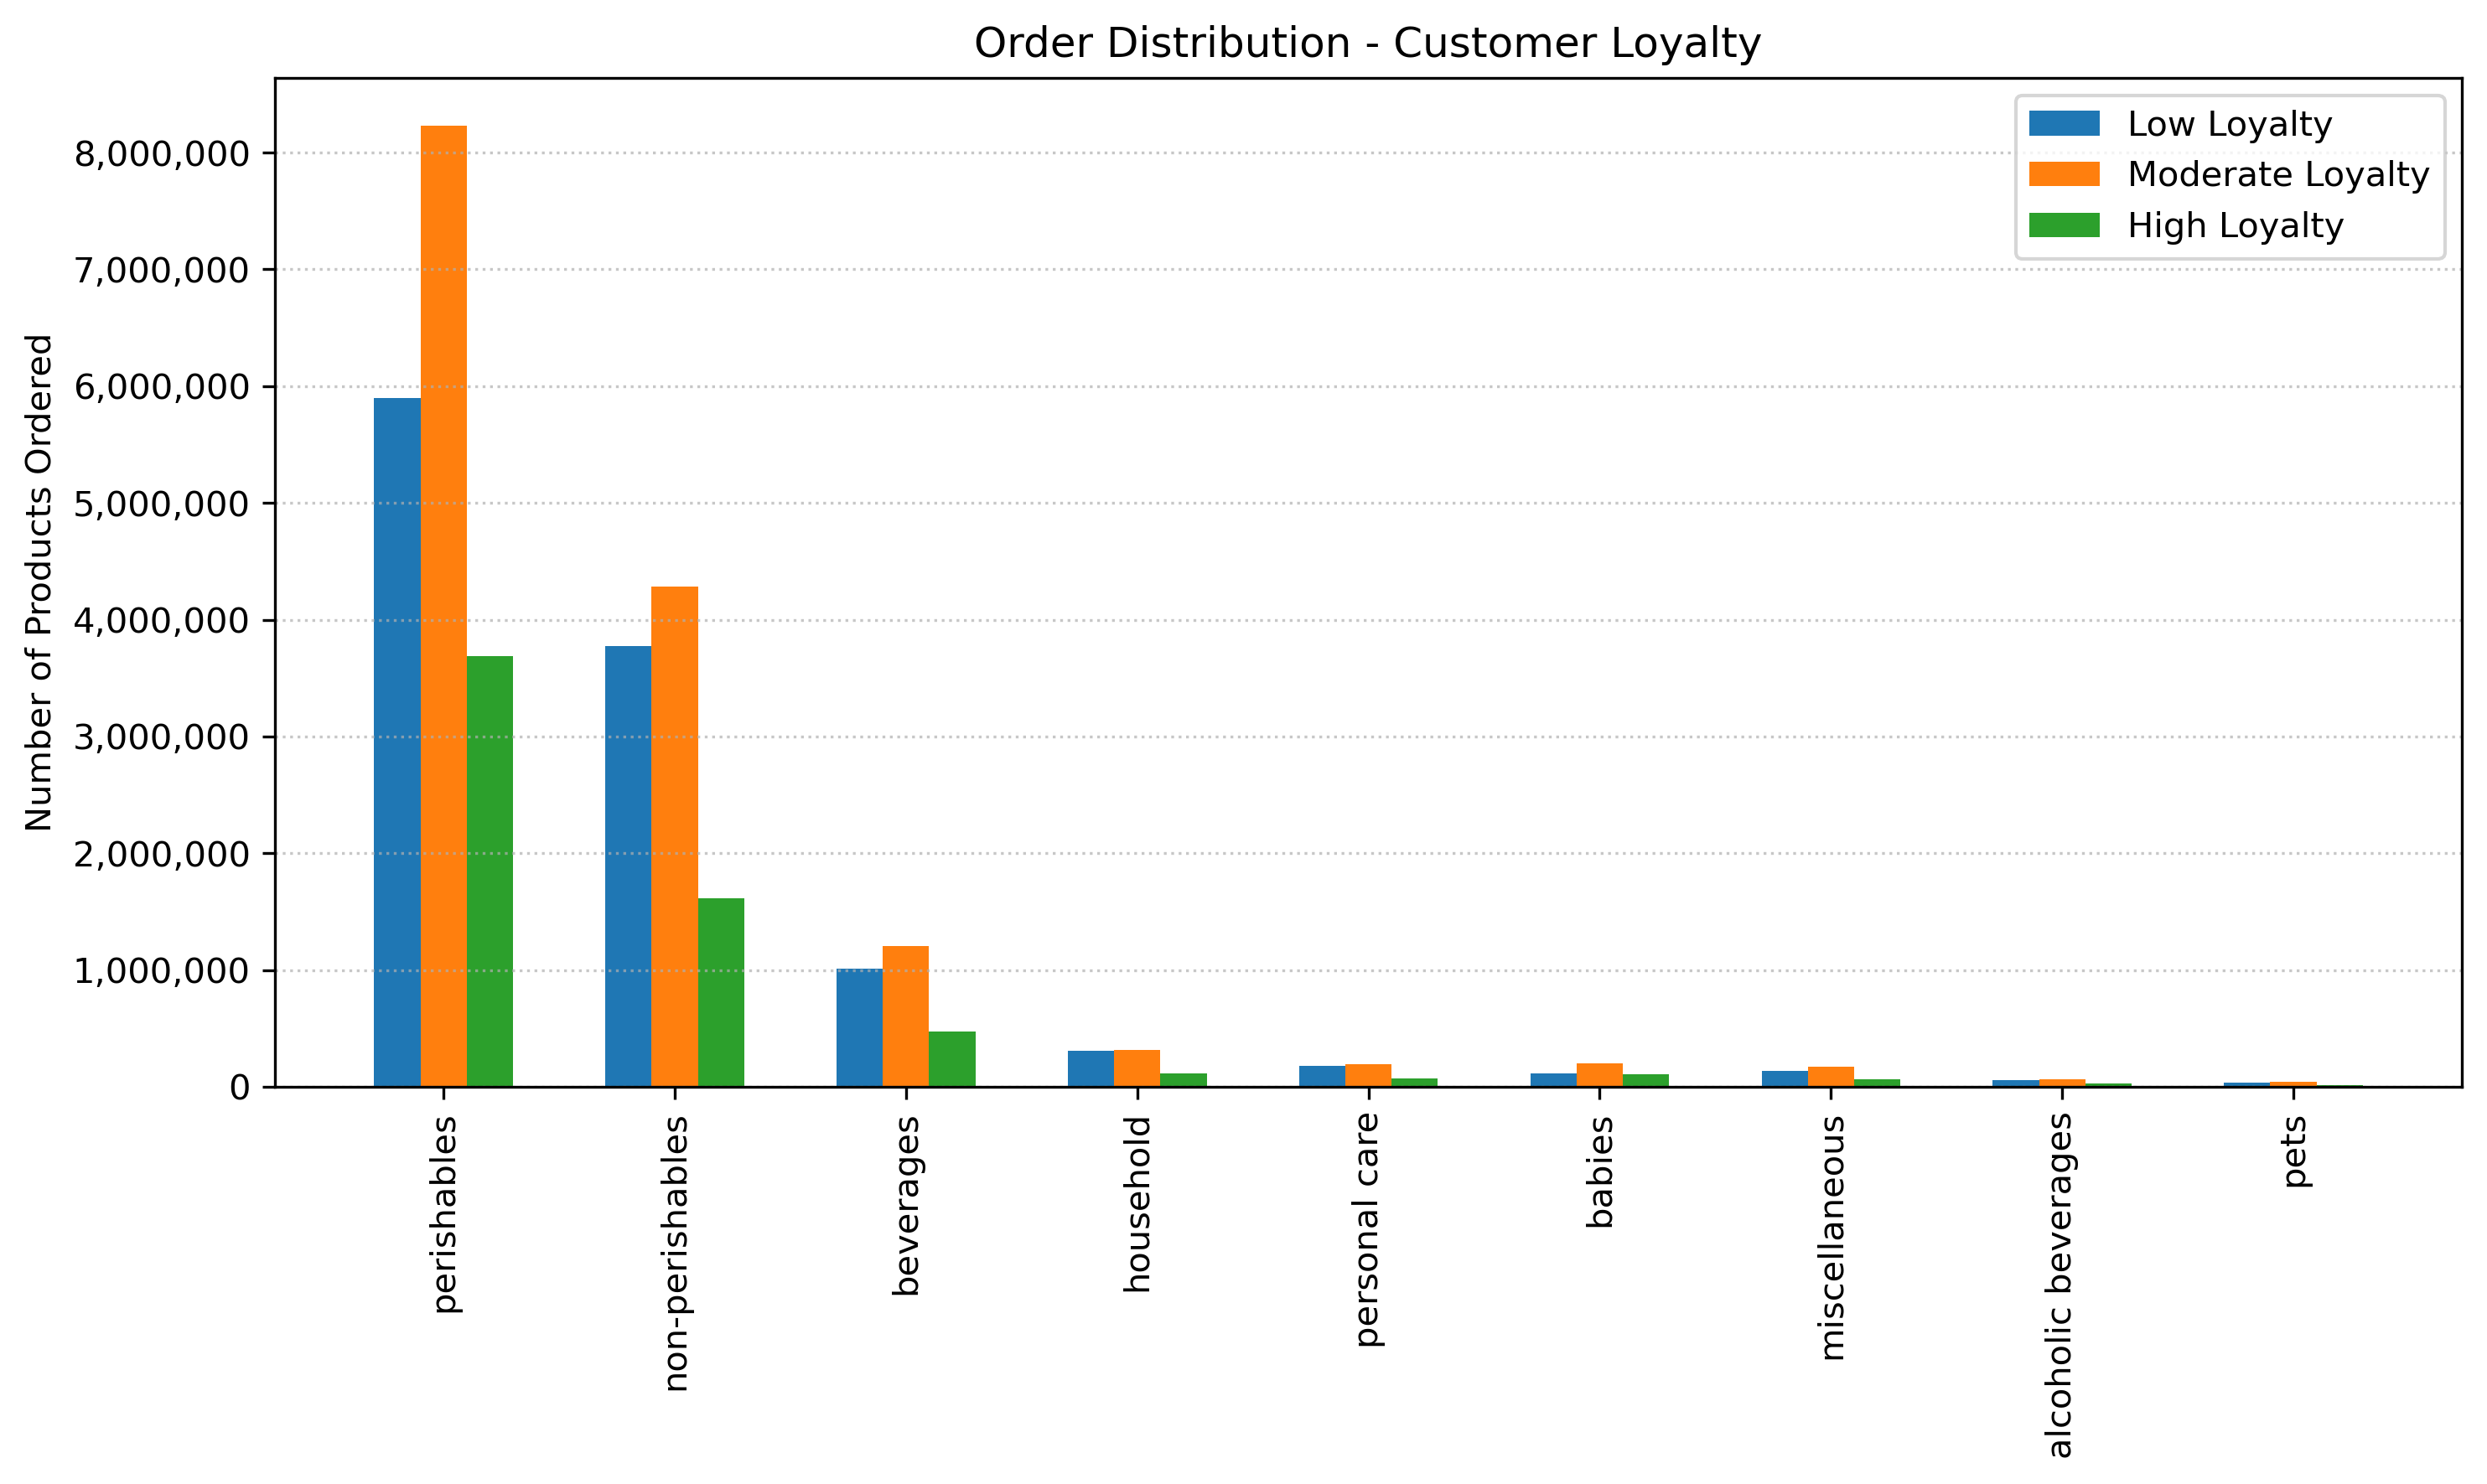
Examining the ordering habits of customer loyalty groups revealed that while low loyalty customers make up the largest portion of the customer base and high loyalty customers the smallest, moderate loyalty customers place the highest total number of orders. Additionally, high loyalty customers place more orders relative to their population size, whereas low loyalty customers place fewer orders in comparison.
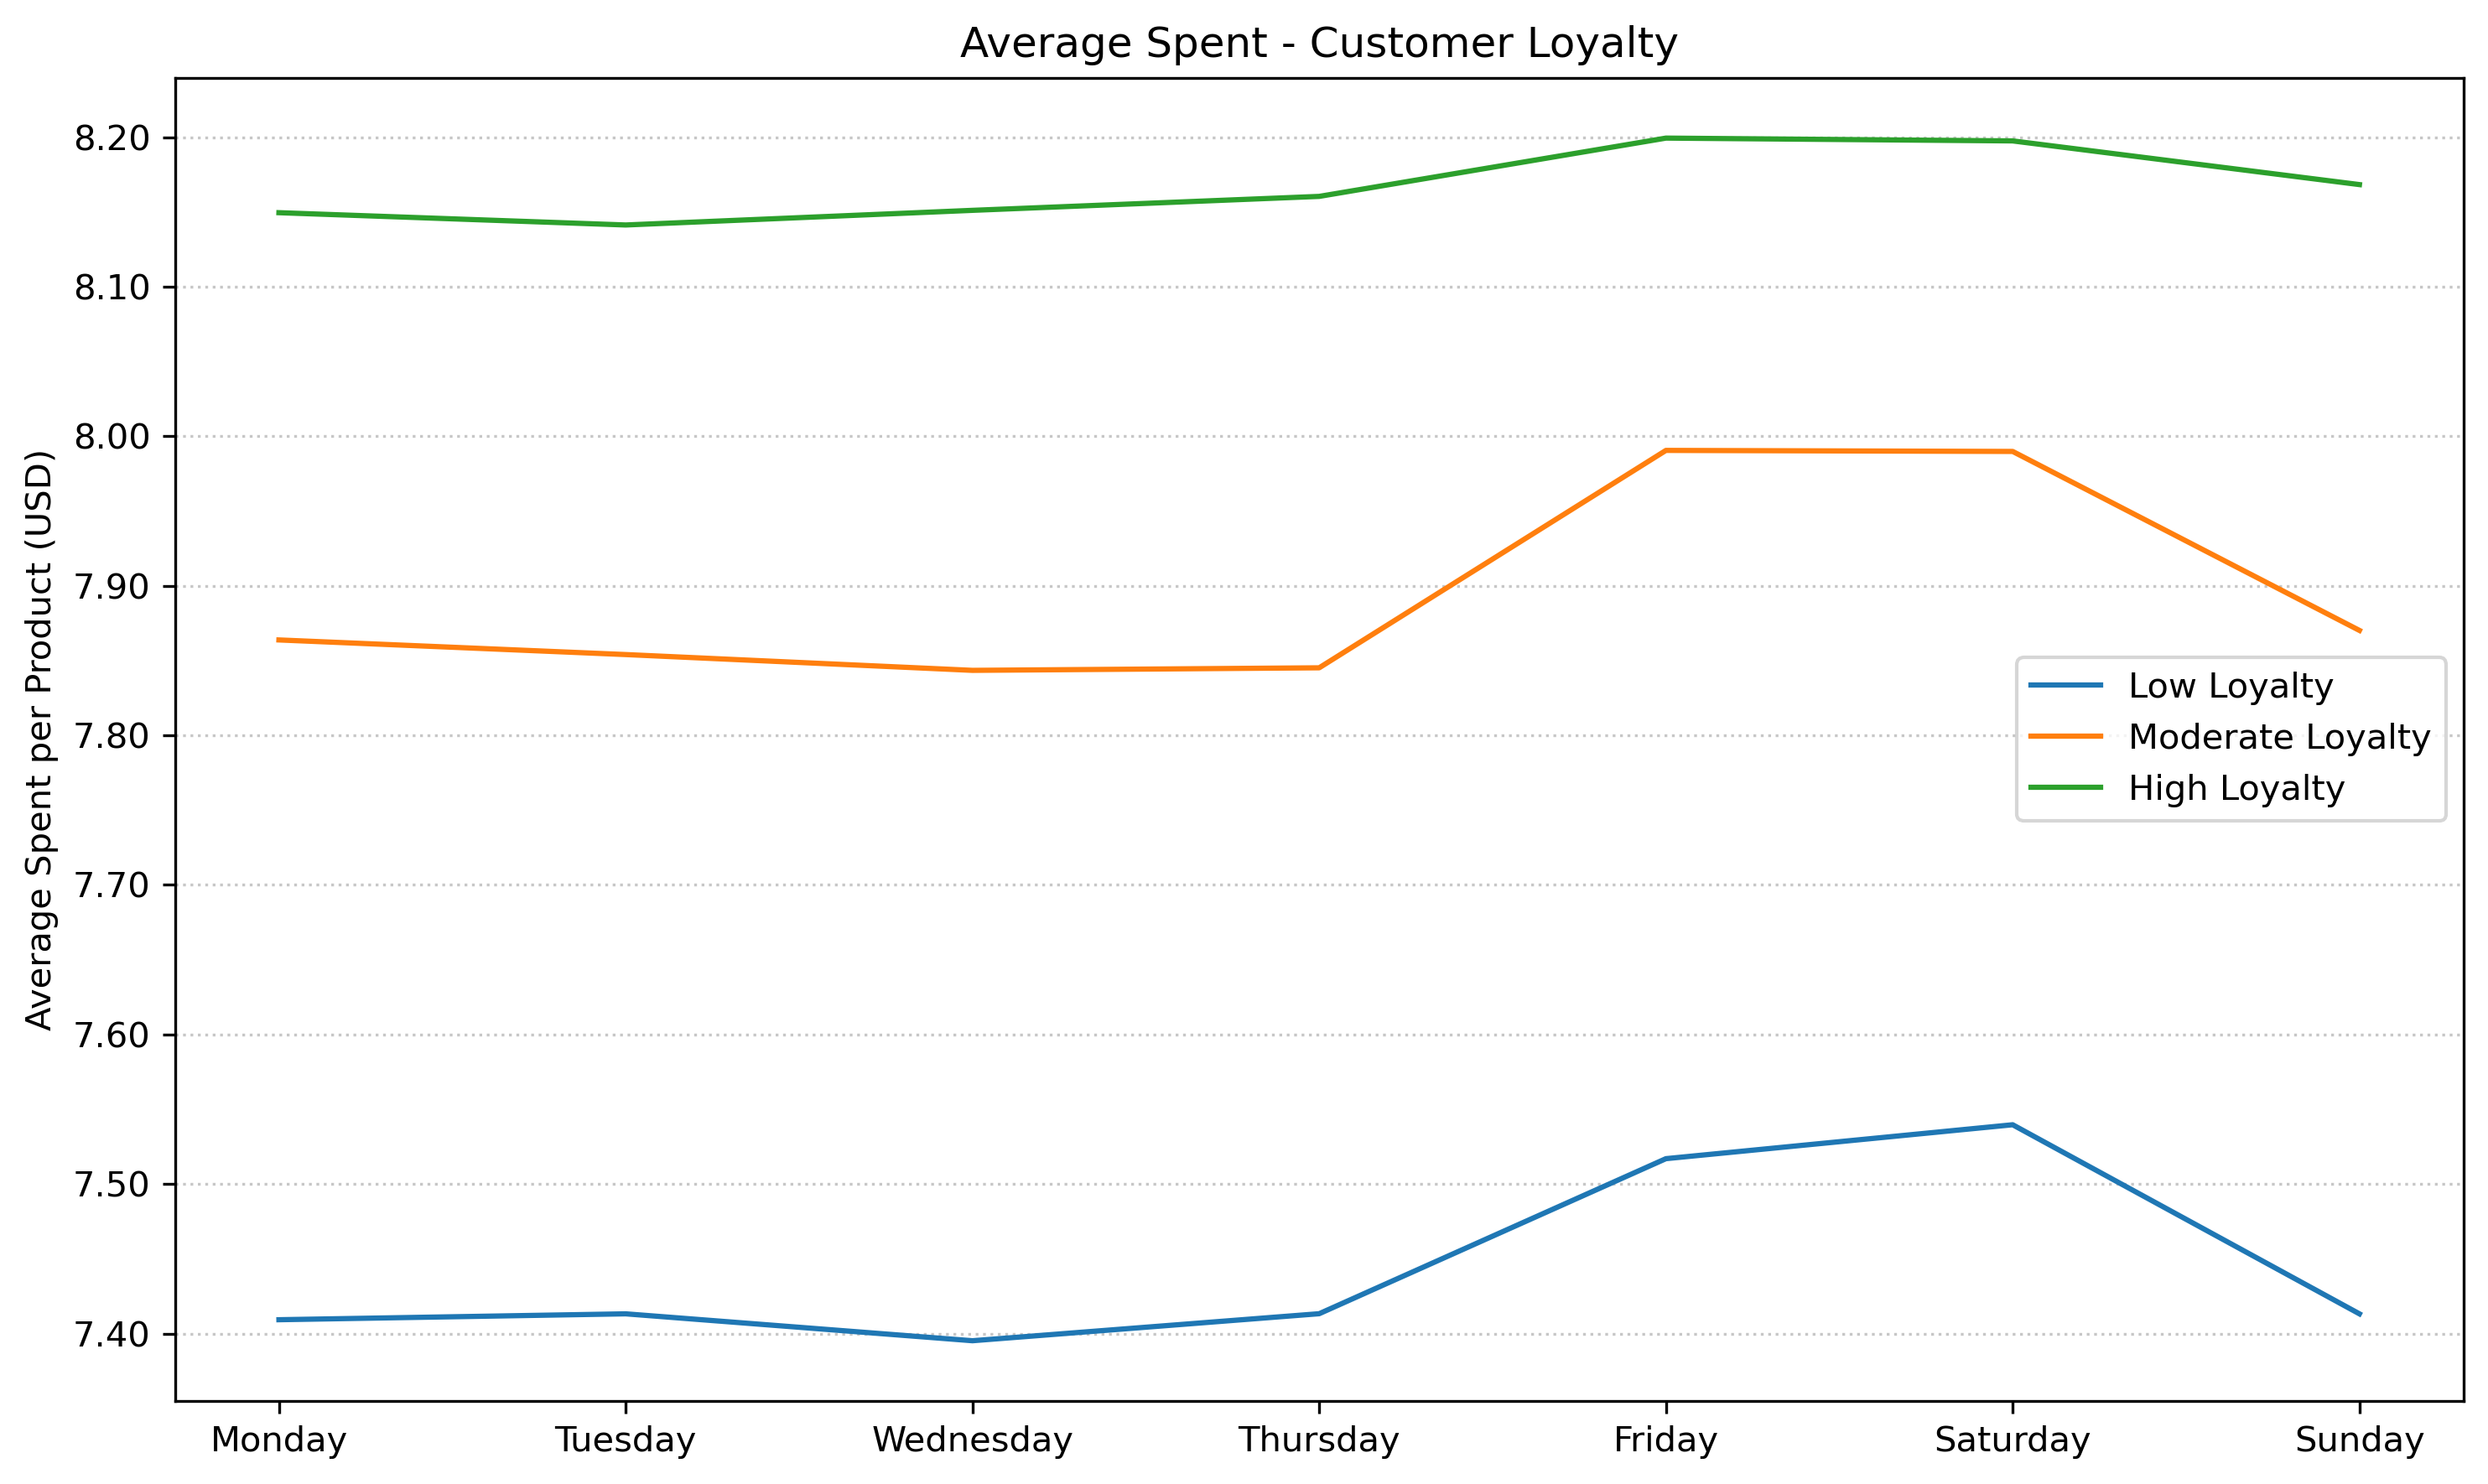
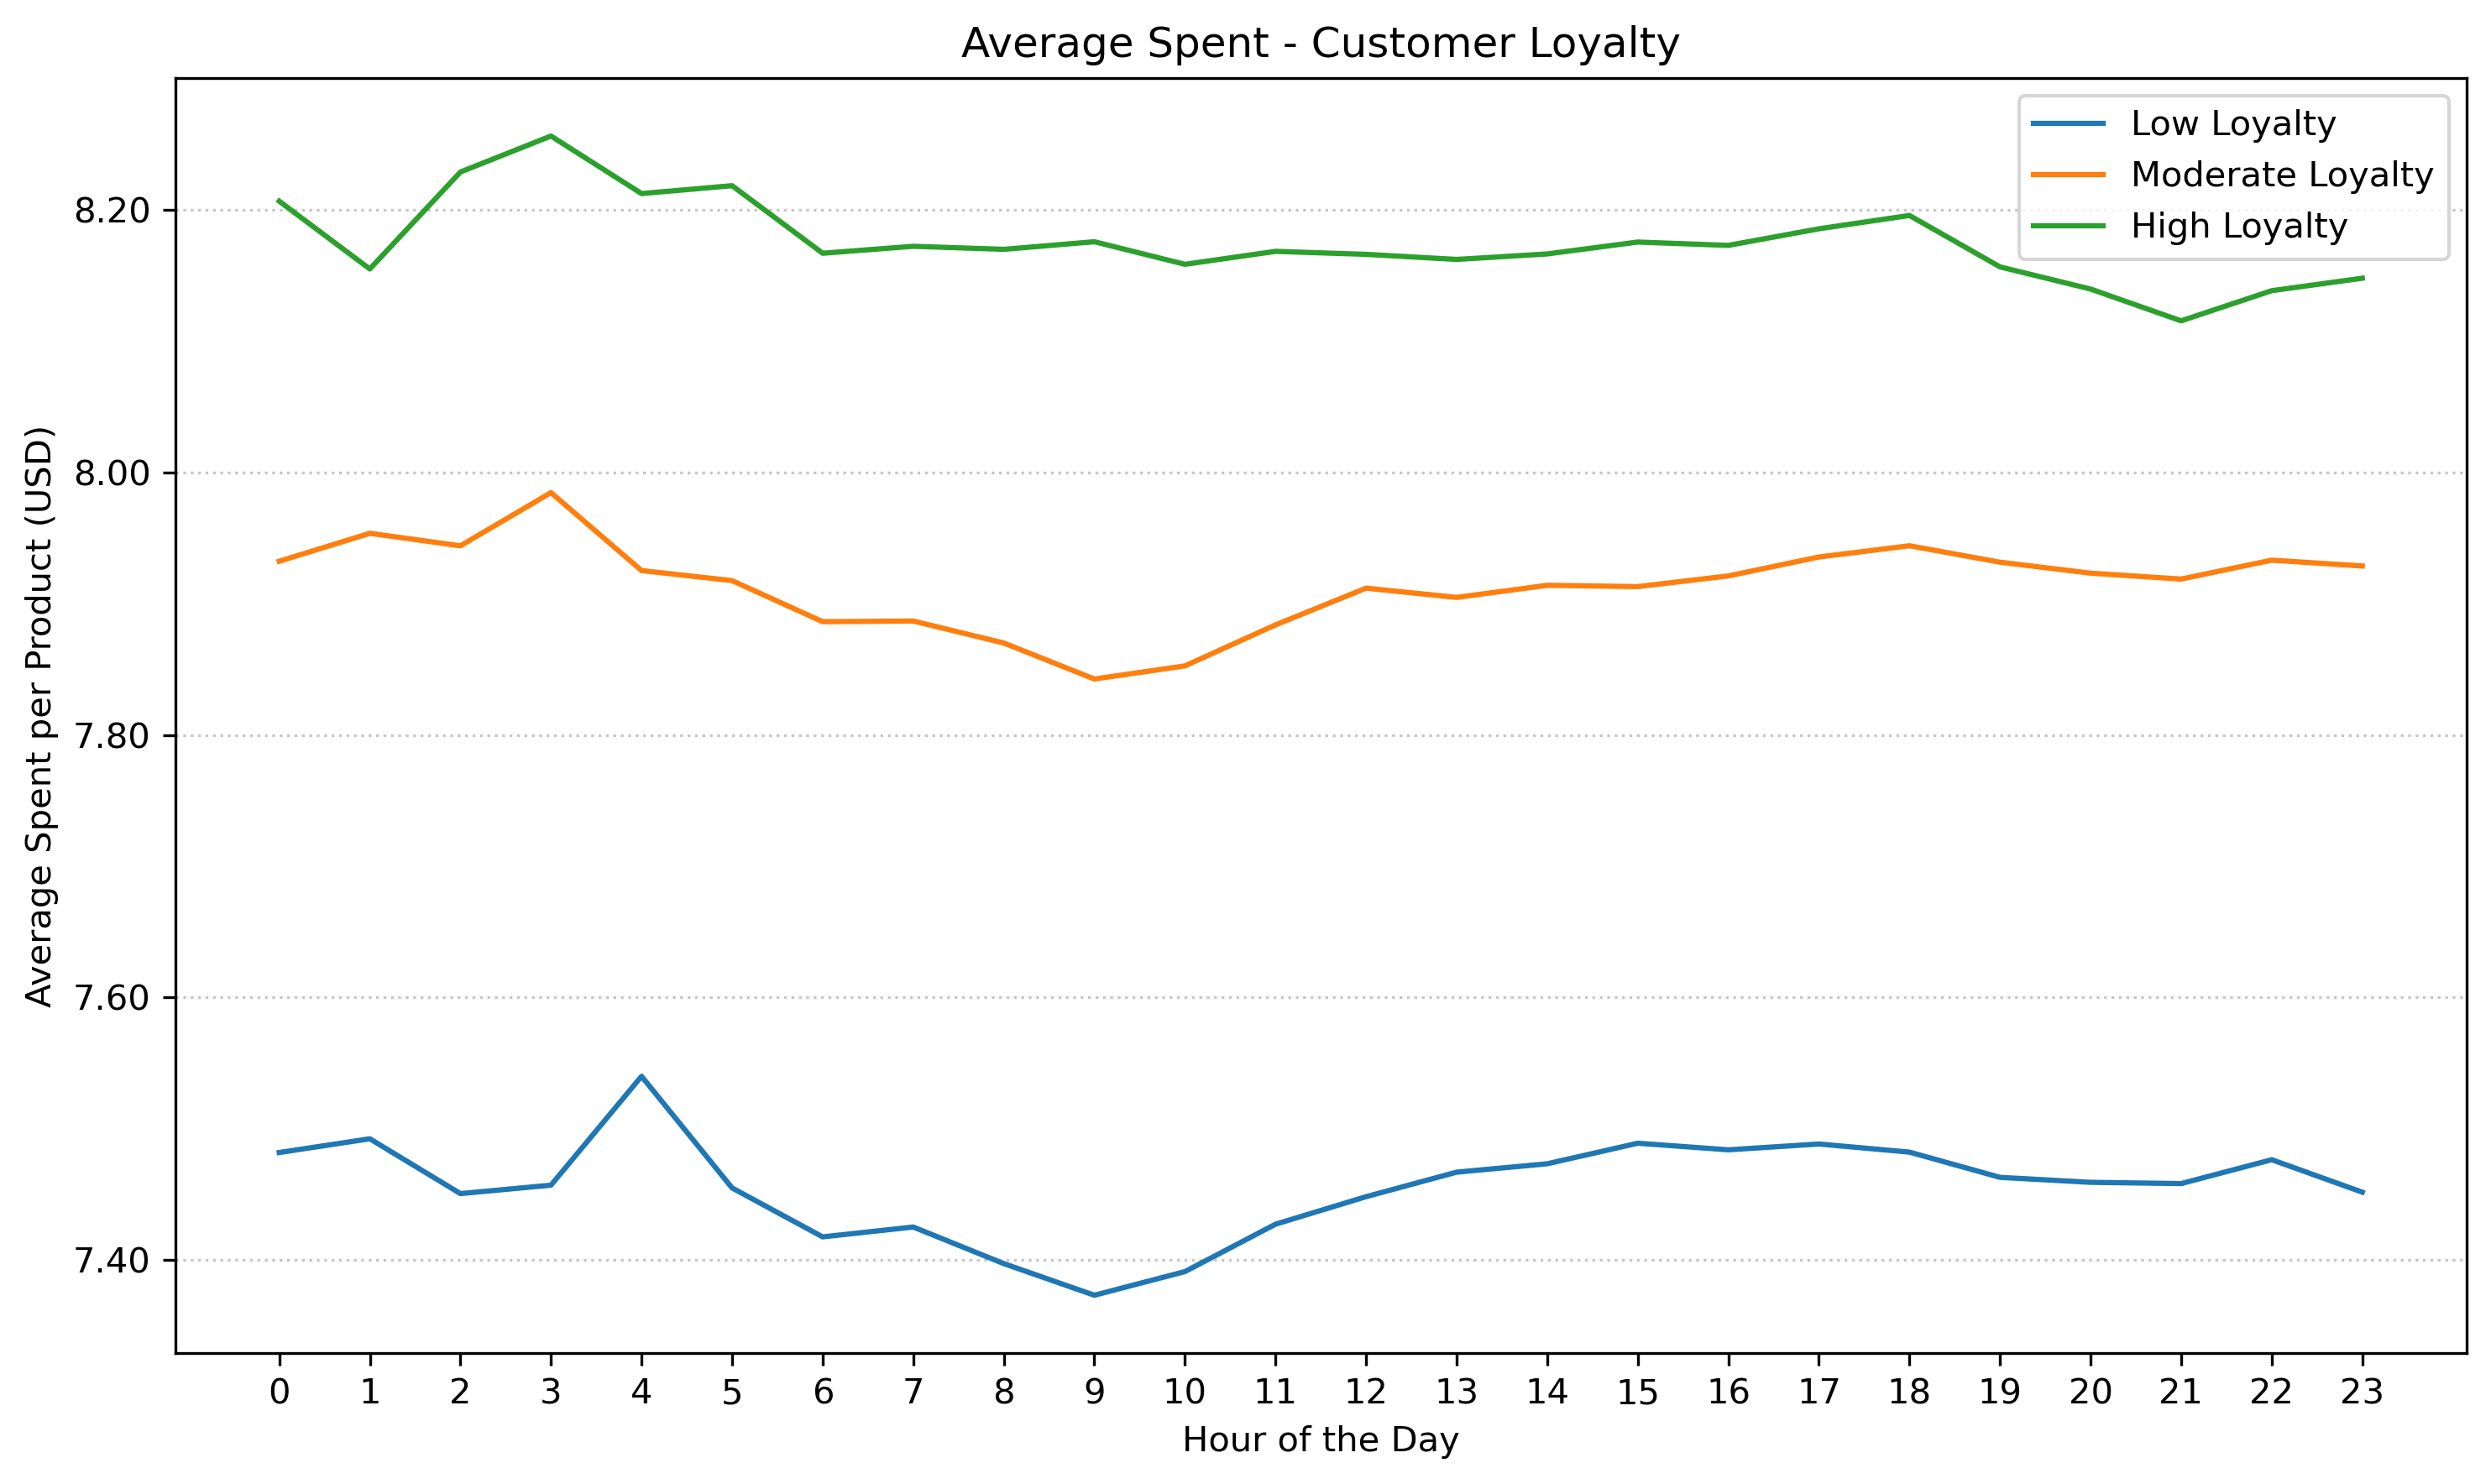
Further analysis showed that moderate and low loyalty customers generally follow overall ordering trends, whereas high loyalty customers deviate from the norm, showing less pronounced peaks in order volume and average spending during peak periods. Notably, high loyalty customers spend the most per item on average, while low loyalty customers spend the least.
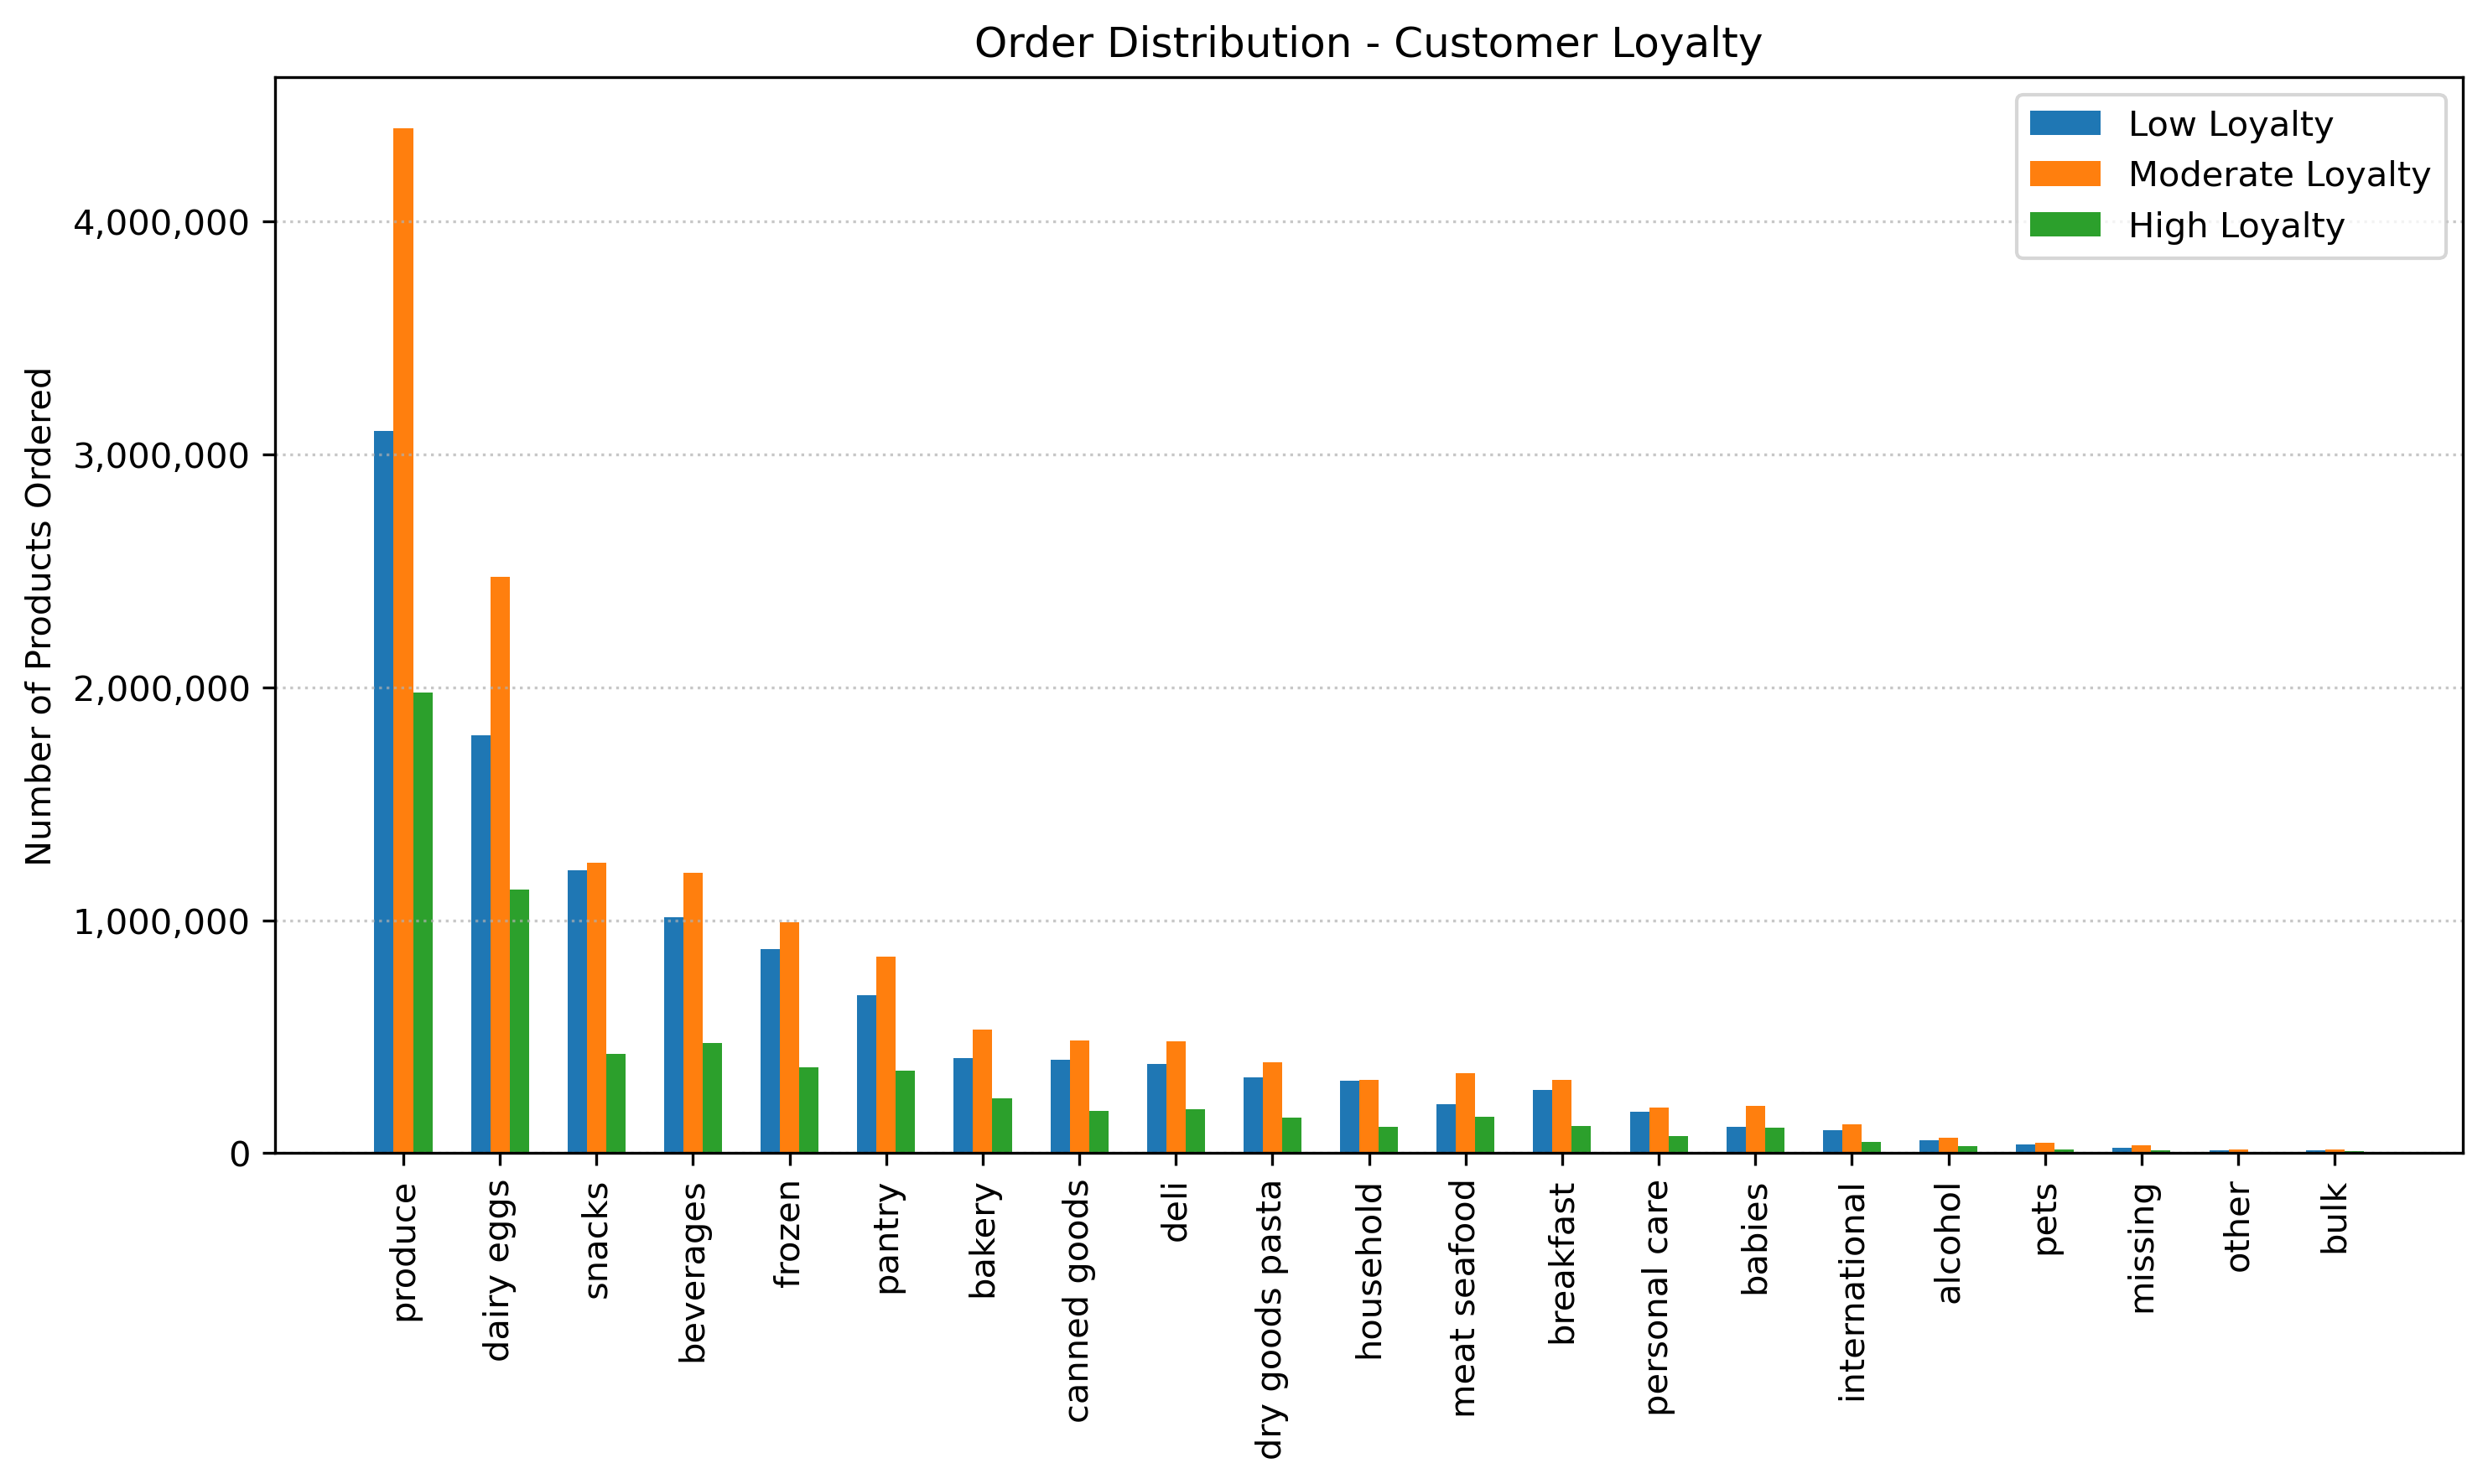
Deviations were also observed in product preferences. Most notably, high loyalty customers’ demonstrated a lower interest in snacks than anticipated, while low loyalty customers’ preference for snacks exceeding expectations.

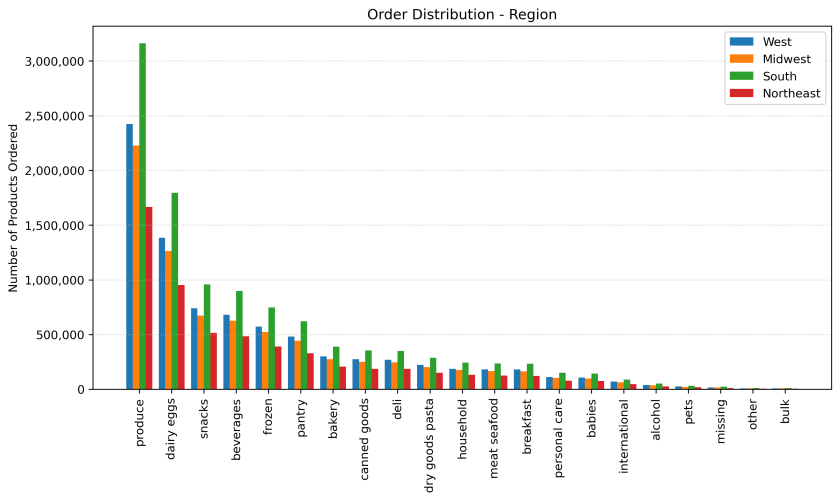
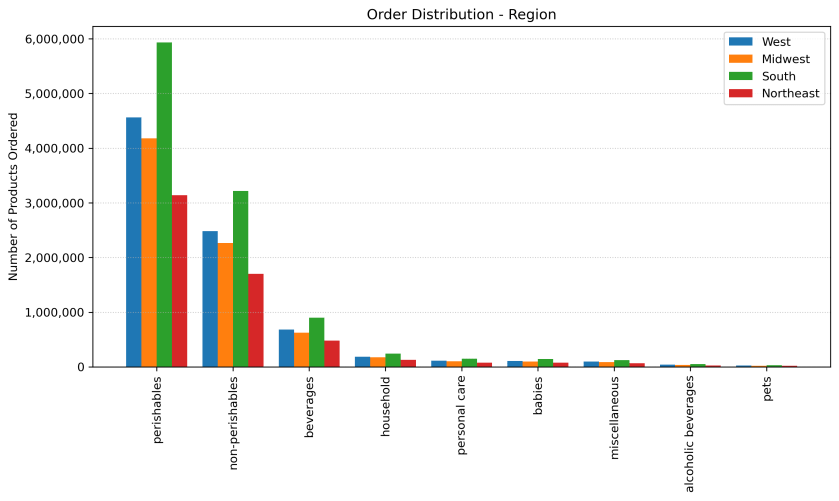
Region
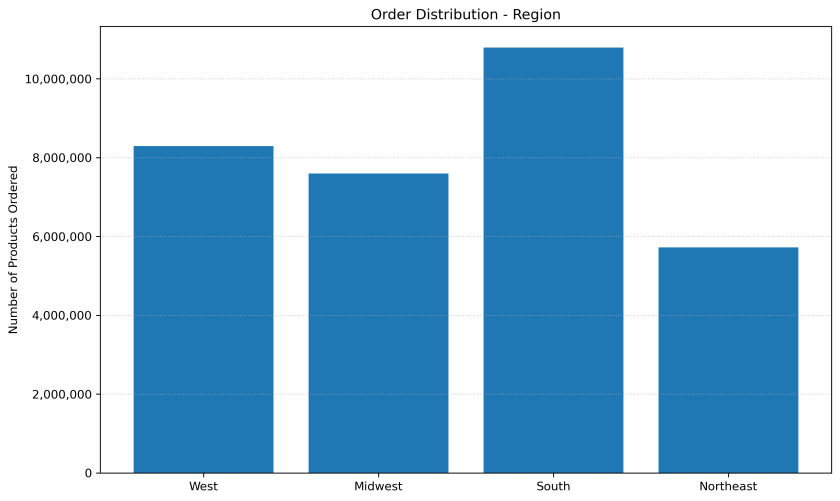
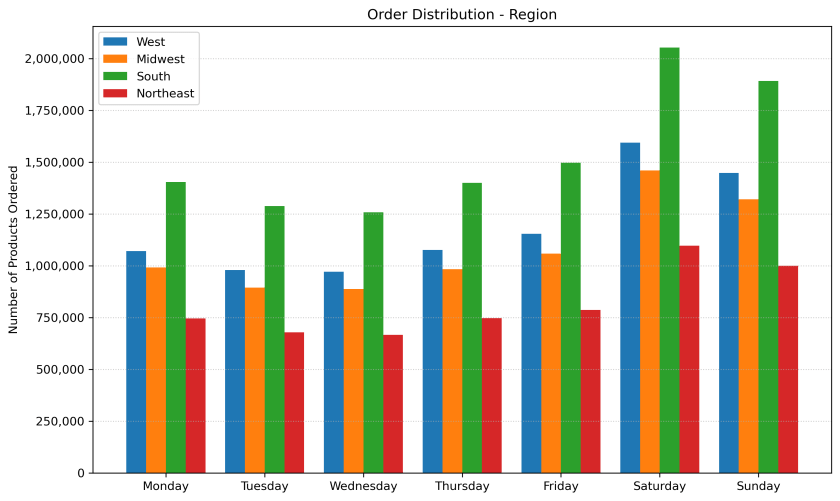
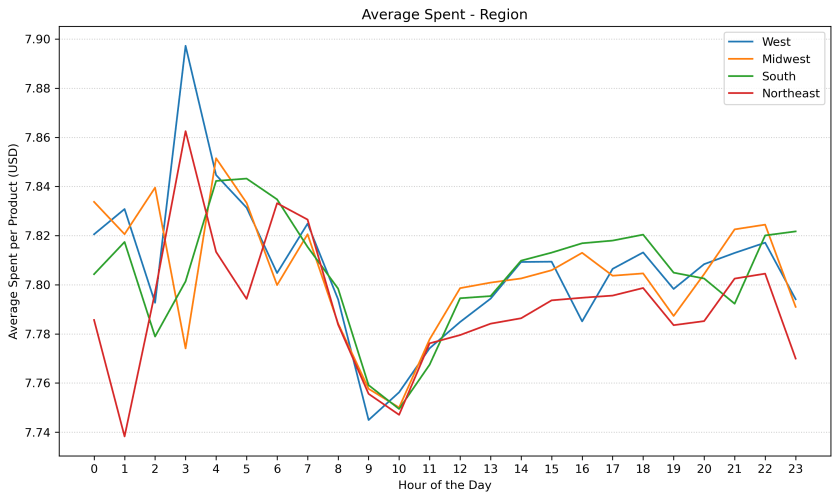
Examining ordering habits across regions revealed that the total number of orders align with the distribution of customers. Further analysis showed that regions generally follow overall ordering trends. However, some deviation was observed in average spending, with the Northeast generally spending less than other regions, showing a notable decline on Tuesdays and at 1 a.m. in the morning.


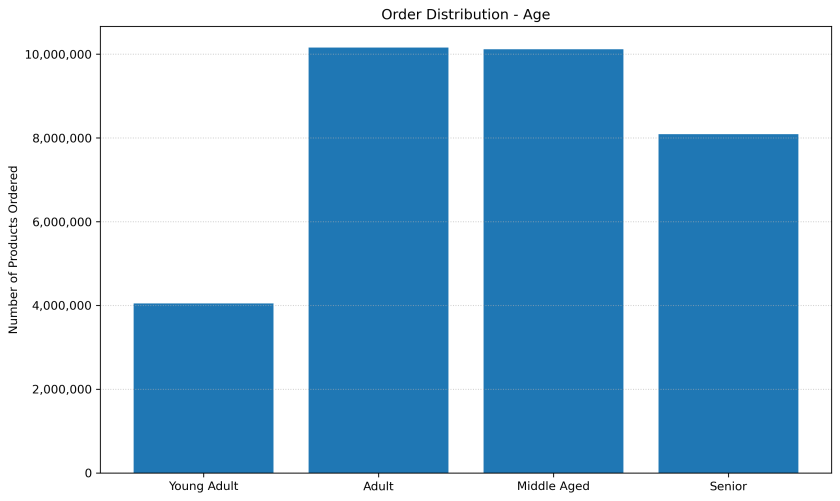
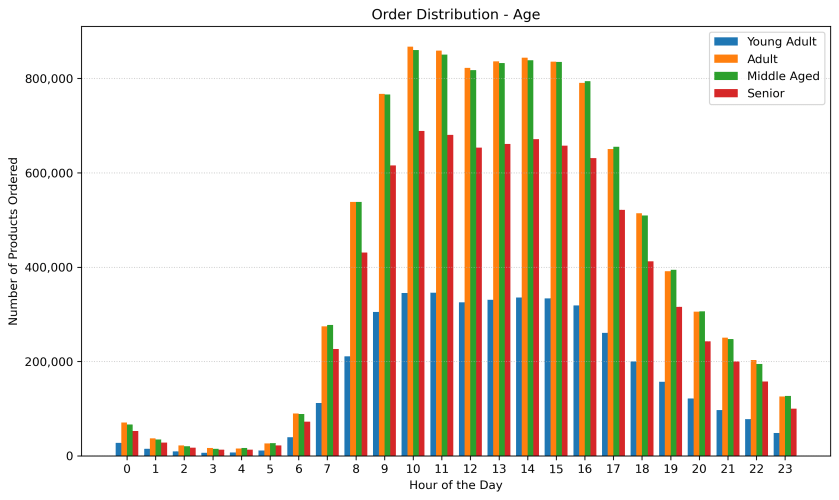
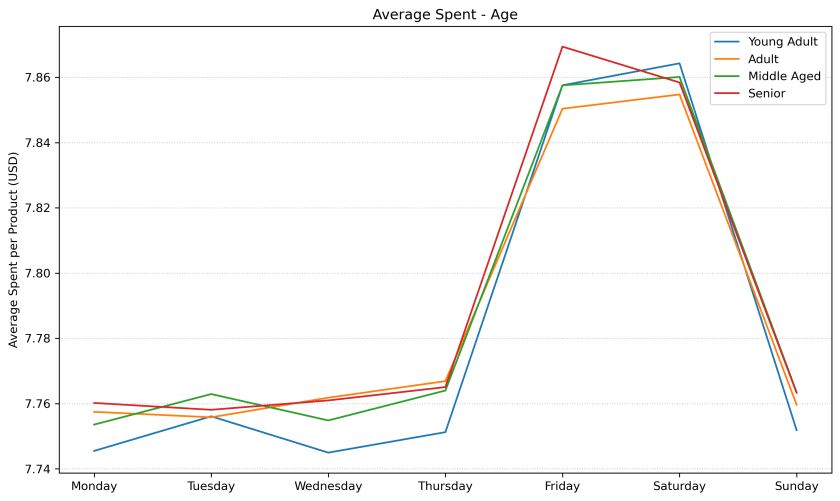
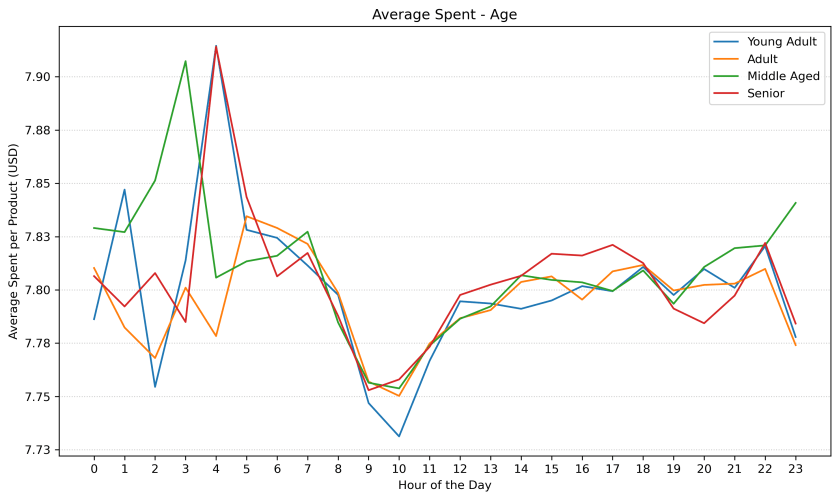
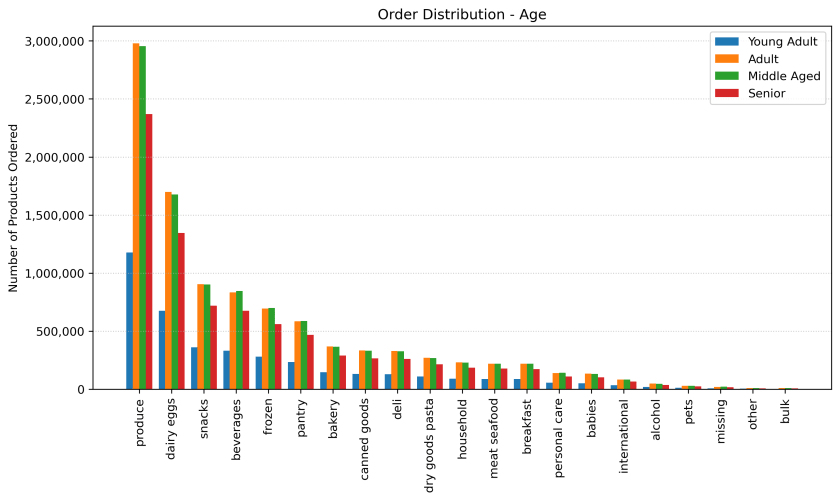
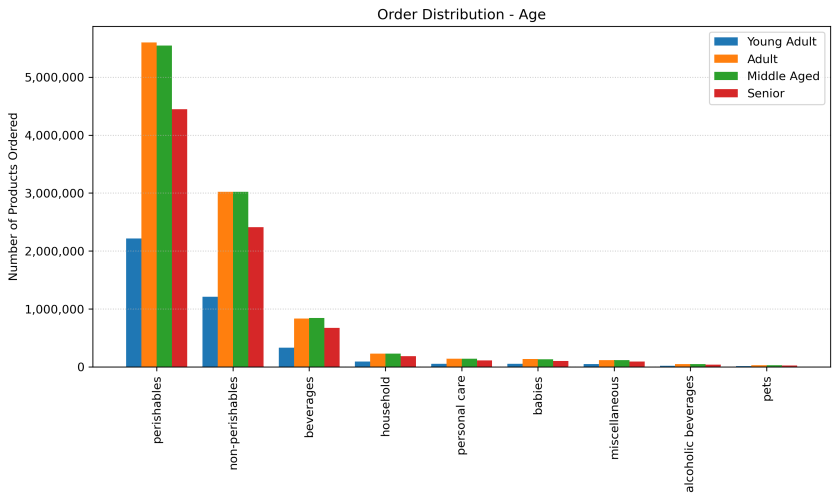
Age
Examining ordering habits across age groups revealed that the total number of orders align with the distribution of customers. Further analysis revealed that age groups generally follow overall ordering trends. However, some deviation was observed in average spending, with young adults and middle aged customers displaying a notable rise in spending on Tuesdays, while seniors’ spending peaking on Fridays, compared to other groups who typically peak on Saturdays. Young adults also tend to spend significantly less than other age groups at 10 a.m. when overall spending is at its lowest.

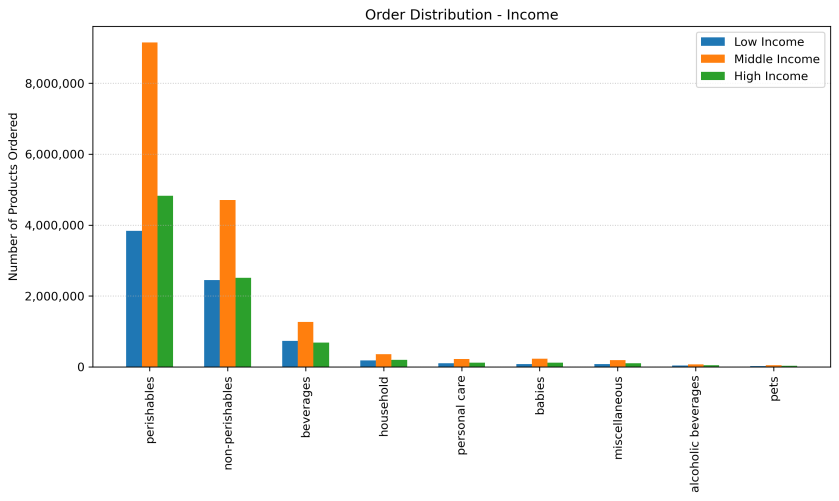
Income
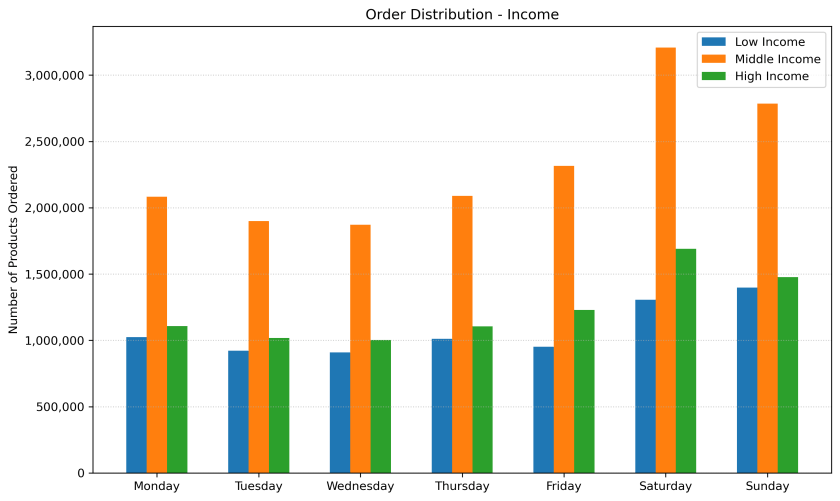
Examining ordering habits across income groups revealed that while middle income customers constitute the largest portion of the customer base and place the most orders, high income customers place more orders relative to their population size, whereas low income customers place fewer orders in comparison.
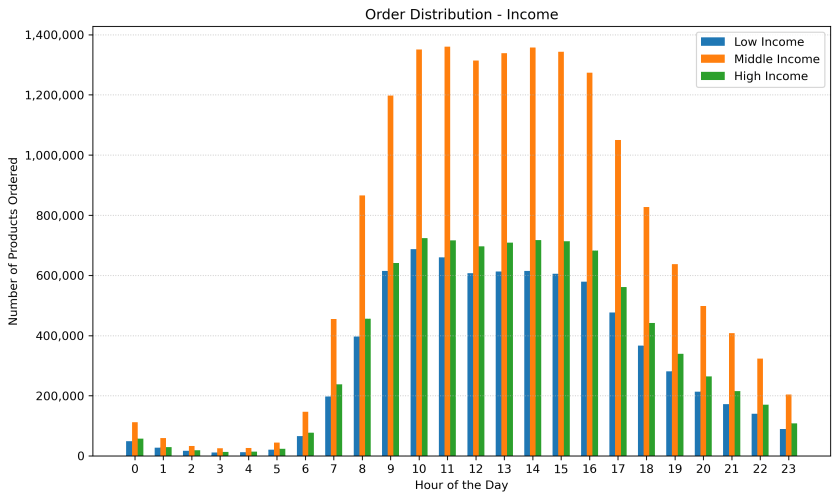
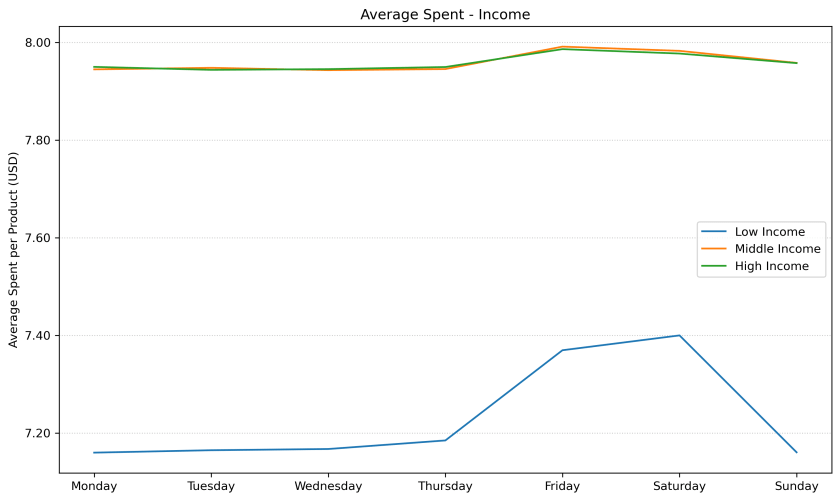
Further analysis showed that middle and high income customers generally follow overall ordering trends, whereas low income customers deviate from the norm, showing later weekly, and earlier daily peaks in order volume. Notably, average spending is closely aligned between middle and high income groups, with only minor variations in hourly spending, while the low income group spends significantly less at all times.
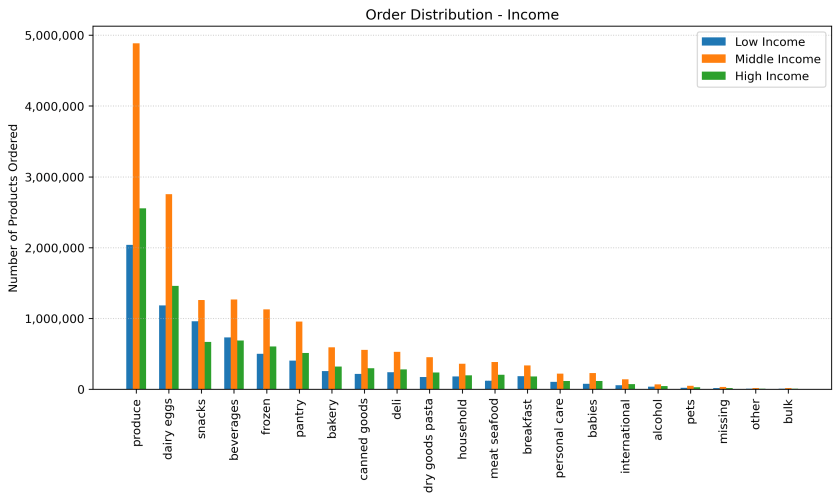
Deviations were also observed in terms of product preferences, with low income customers favouring non-perishables more in proportion to their customer base, particularly snacks and beverages.


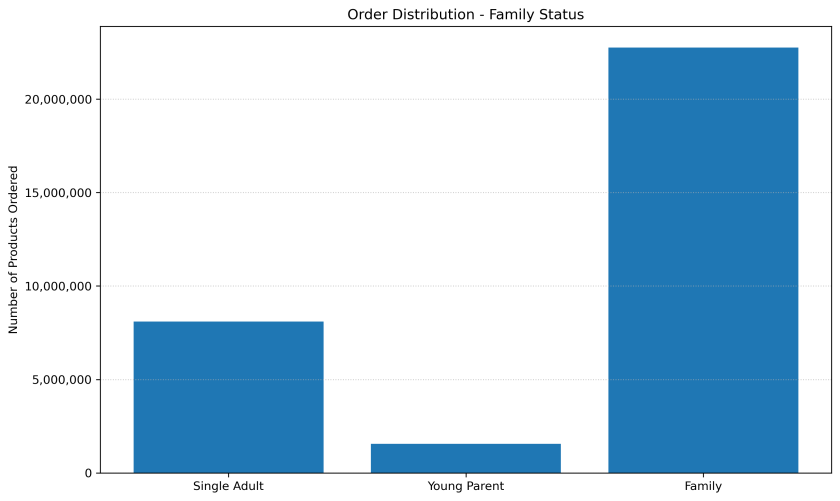
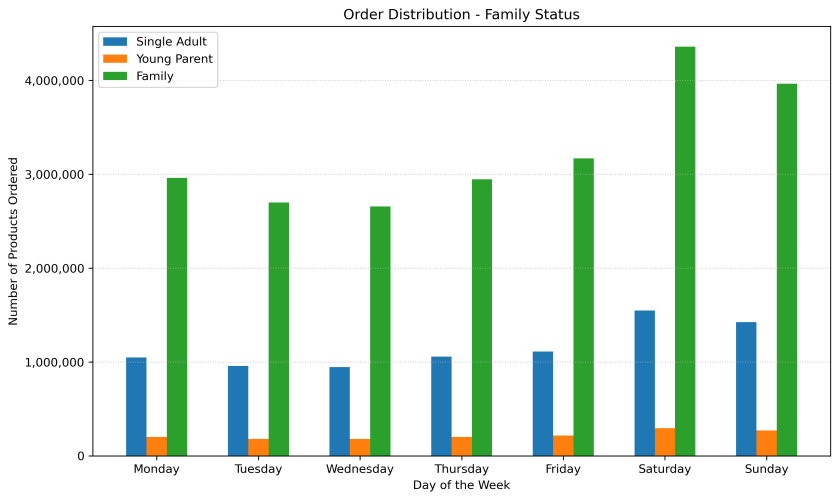
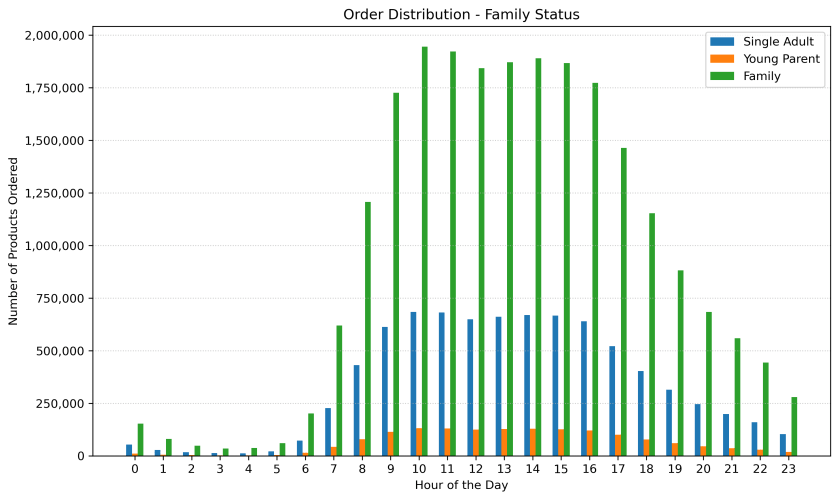
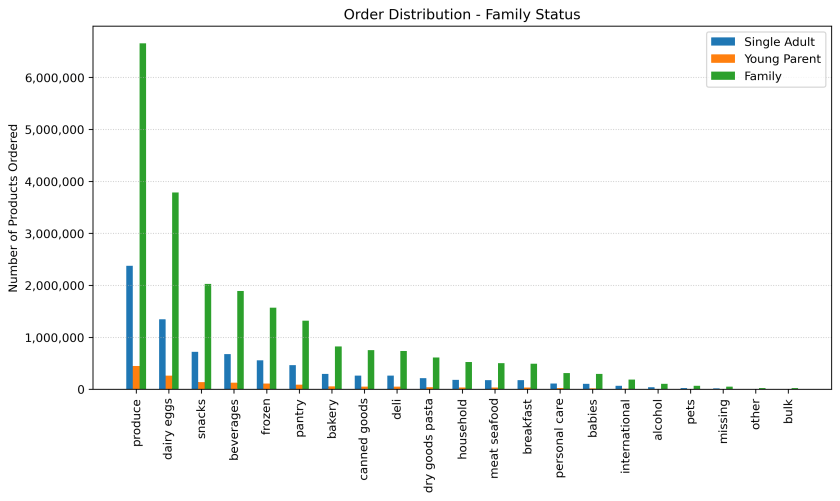
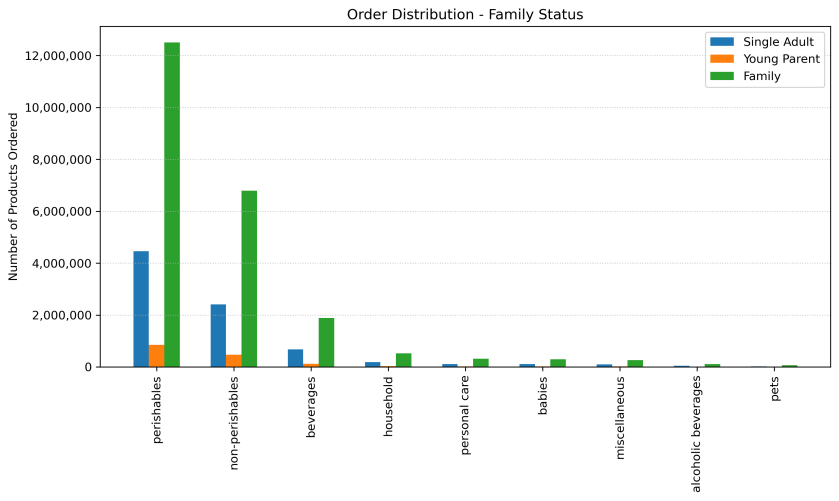
Family Status
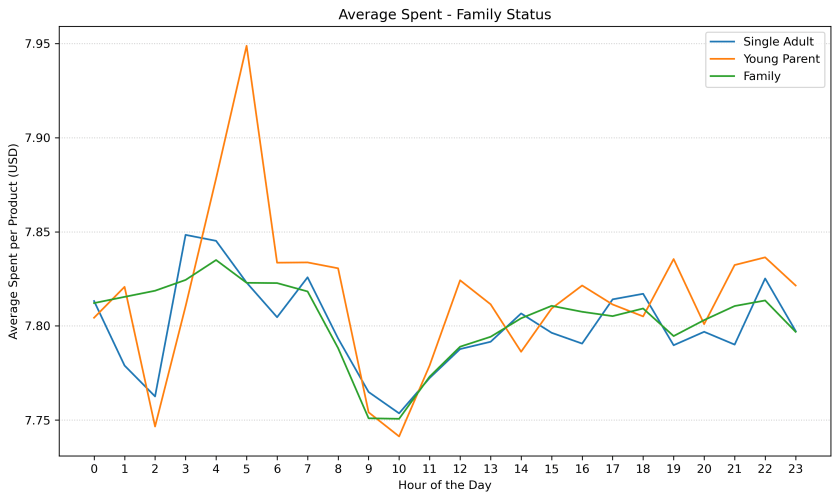
Examining ordering habits across customer family groups revealed that the total number of orders aligns with the distribution of customers. Further analysis showed that family groups generally follow overall trends. However, some deviation was observed in average spending with young parents displaying a notable rise in spending on Tuesdays and Wednesdays, while hourly spending exhibit another notable peak at 5 a.m. Spending on Saturdays also showed a distinct difference between age groups.