
Analysis & Insights – Objective 1
Ordering Trends
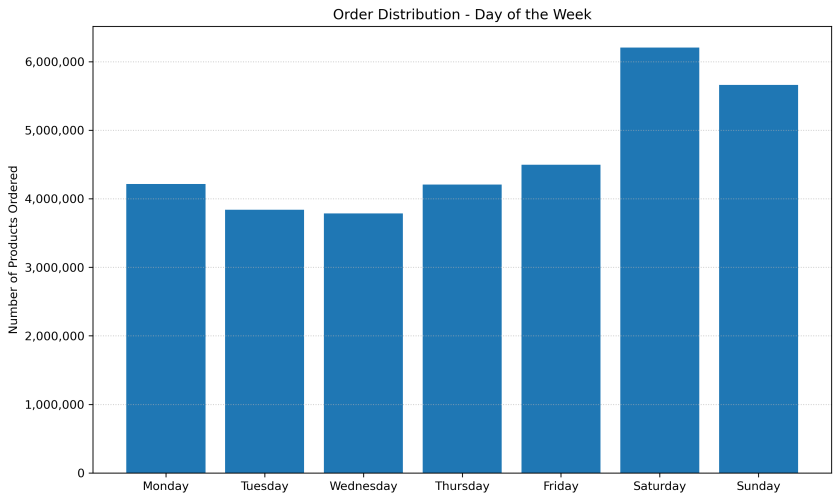
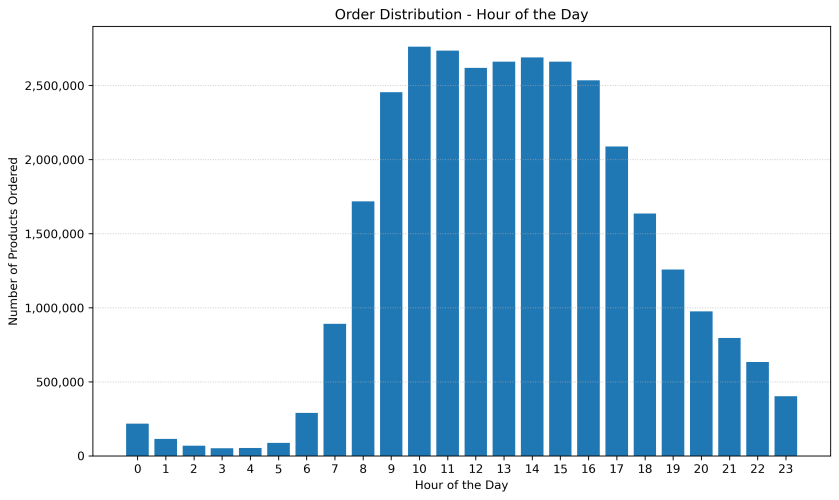
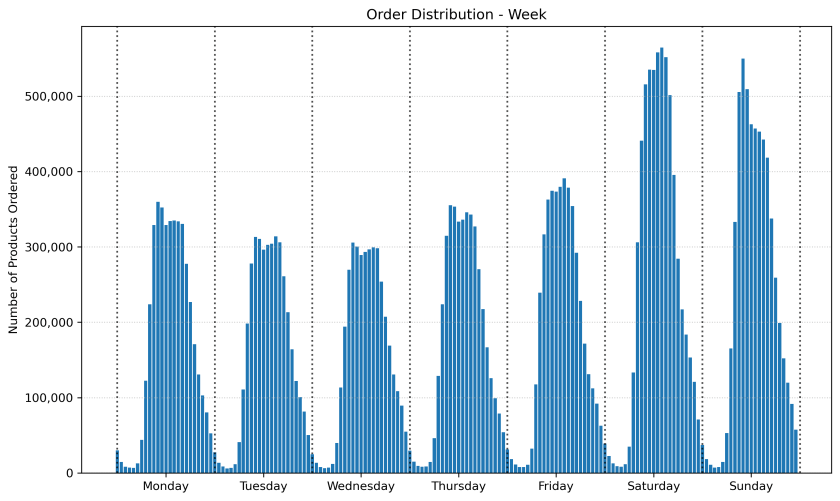
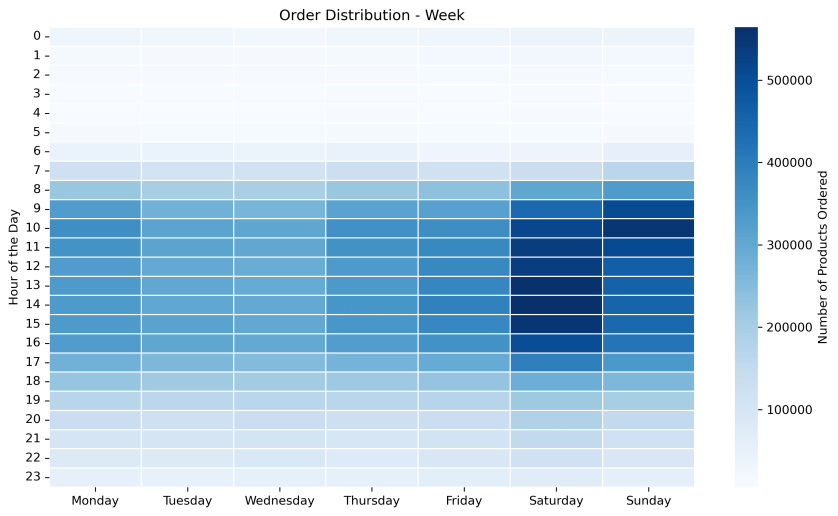
Q1: How does order volume fluctuate over time?
Analysing order volumes over time revealed that the highest activity occurred on Saturdays and Sundays, with the lowest number of daily orders observed on Tuesdays and Wednesdays. Peak ordering hours were observed daily between 9 a.m. and 4 p.m., followed by a gradual decline in the evenings, reaching their lowest levels in the early morning before 7 a.m.
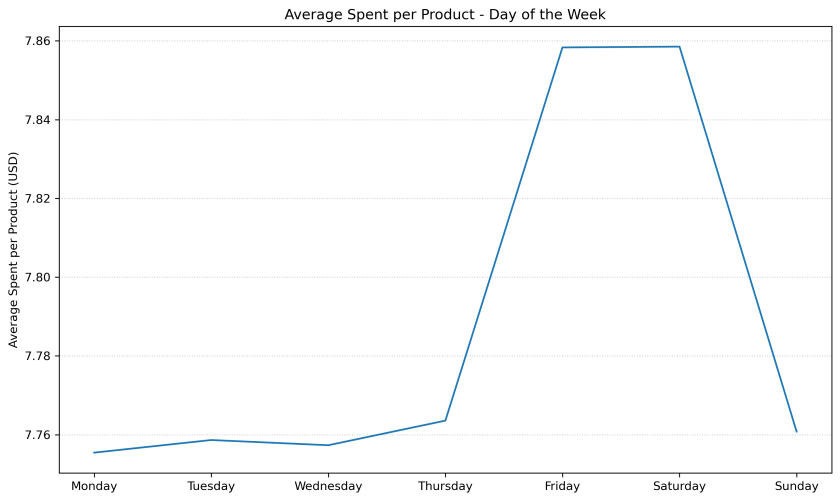
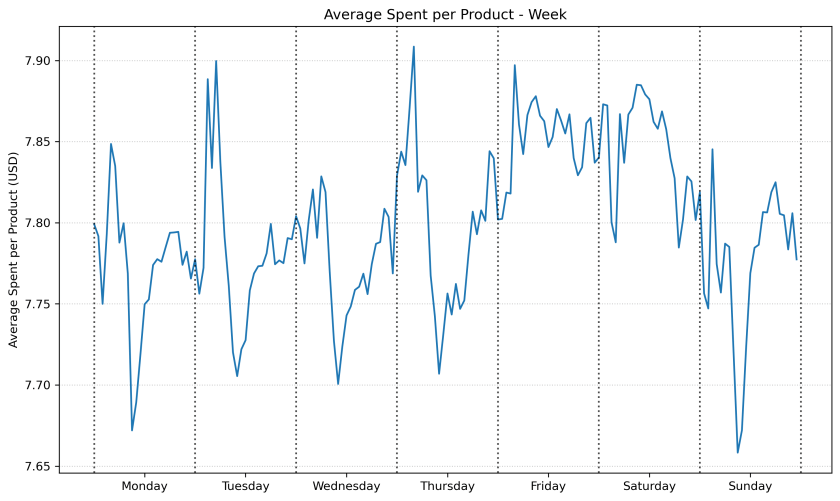
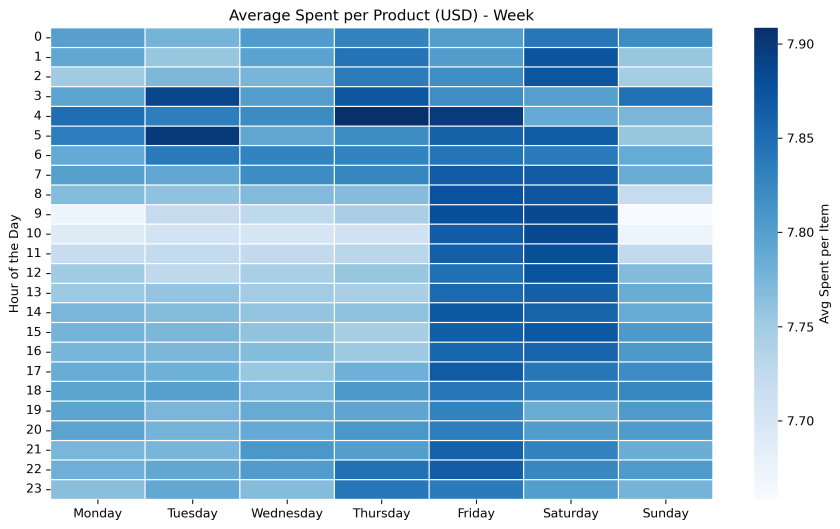
Q2: How does average spending per product vary over time?
Analysing average spending per product over time reveals consistent patterns from Sunday to Thursday. Early morning spending is elevated, but shows sporadic behaviour, with occasional peaks between 3 a.m. and 6 a.m. This is followed by a sharp decline to the lowest spending levels between 9 a.m. and 12 p.m., after which it stabilises at a moderate level until midnight.
In contrast, spending on Fridays and Saturdays remains consistently high throughout the day, reaching the highest daily averages. This increase begins on Thursday at 10 p.m. and persists until Sunday, when spending returns to normal levels.

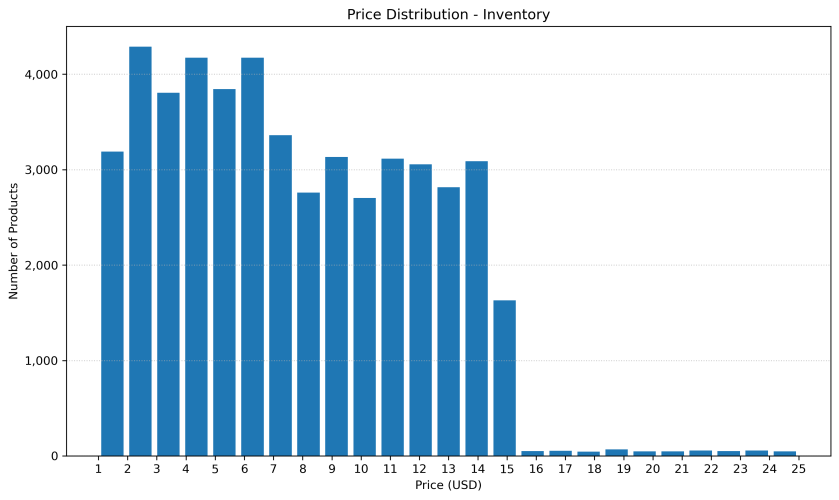
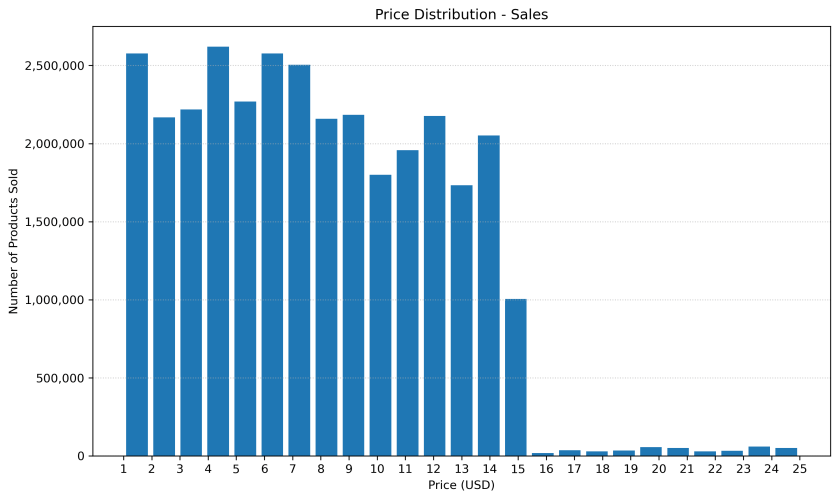
Q3: How can products be categorised into price ranges to support product placement?
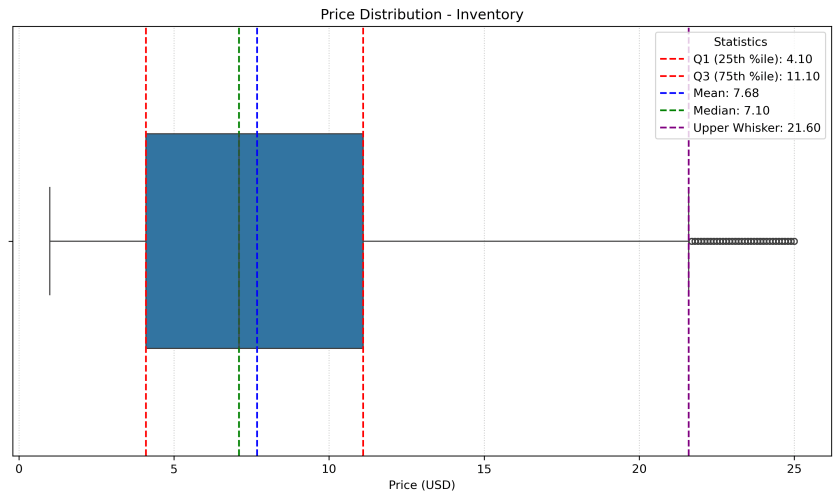
A price distribution analysis revealed that most products are priced between $1 and $15, with a median inventory price of $7.10 and a median sales price of $7.40. While the majority fall within this range, a smaller portion of products are priced between $15 and $25.
To support optimised product placement that aligns with spending habits, premium products were first defined by their limited availability. The interquartile range (IQR) was then applied to classify the remaining products based on their price distribution as follows:
- Low Price ($1 to $4.2) – Products below Q1.
- Mid Price ($4.2 to $11.3) – Products between Q1 & Q3.
- High Price ($11.3 to $15) – Upper portion of readily available inventory
- Premium Price ($15 to $25) – Outliers ordered less frequently

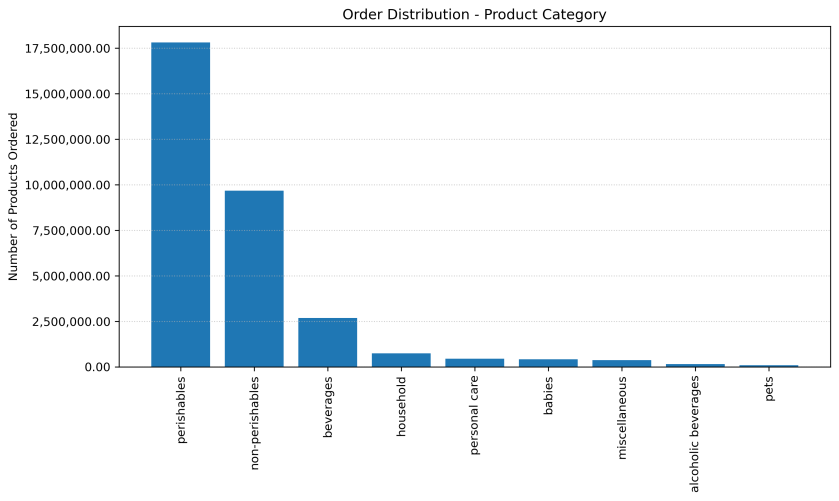
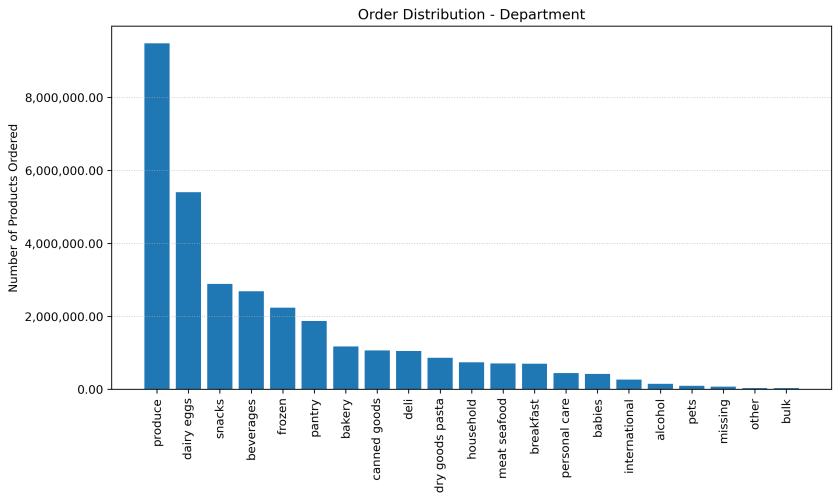
Q4: Which products, within their respective departments and categories, are most popular?
To analyse product popularity, departments were grouped into simplified categories based on shelf life, with a separate category for miscellaneous items:
- Perishables – Includes departments such as produce, dairy, bakery, eggs, deli, meat, and seafood, all of which have a short shelf life.
- Non-Perishables – Covers snacks, frozen goods, bulk items, canned goods, dry goods, pasta, pantry staples, and breakfast items, which have an extended shelf life.
- Miscellaneous – Consists of departments such as international, missing, and other.
Analysis revealed that perishables are the most frequently ordered category, followed by non-perishables. In contrast, categories like alcoholic beverages, pet supplies, and miscellaneous items exhibit significantly lower order frequencies. Within perishables, produce leads in order volume, followed by dairy and bakery items. Among non-perishables, snacks, frozen goods, and pantry staples receive the highest number of orders.